Running a business means making decisions before you have all the facts.
Should you hire another employee? Can you afford new equipment? Will customer collections cover payroll next month? Can your company expand without creating a cash shortage?
Financial forecasting helps business owners answer these questions by estimating future revenue, expenses, profitability, and cash flow.
However, not every forecasting method is designed to answer the same question.
Some methods use historical trends to estimate future performance. Others connect financial results to sales volume, pricing, staffing, or operating capacity. A 13-week cash forecast can reveal a liquidity problem that may not appear in an annual profit projection.
Financial forecasting methods are techniques and planning approaches used to estimate future financial performance based on historical data, business drivers, market conditions, and management assumptions.
The best approach depends on your business model, available information, planning horizon, and the decisions management needs to make.
This guide explains the major financial forecasting methods, provides practical examples, and shows how to select an appropriate approach for your business.
What Is Financial Forecasting?
Financial forecasting is the process of estimating future financial outcomes using available information and assumptions.
Businesses commonly forecast:
- Sales and revenue
- Cost of goods sold
- Gross profit
- Operating expenses
- Payroll and staffing costs
- Cash receipts and payments
- Capital expenditures
- Financing requirements
- Profitability
- Assets and liabilities
A forecast is not a guarantee of future results.
It is a structured estimate that helps management prepare for likely outcomes and understand the potential consequences of changing business conditions.
For example, a company may forecast $3 million in annual revenue based on its current sales pipeline, customer retention, pricing, and operating capacity.
If customer demand declines or a major contract is delayed, management should update the forecast rather than continue relying on assumptions that are no longer realistic.
According to Harvard Business School Online, financial forecasting supports decisions involving budgeting, hiring, revenue expectations, and strategic planning.
The real value comes from connecting projected financial results to decisions the business must make.
Two Main Categories of Financial Forecasting Methods
Financial forecasting techniques are commonly categorized as quantitative or qualitative.
Quantitative Forecasting
Quantitative forecasting uses numerical information, historical patterns, and statistical relationships to estimate future results.
Common techniques include:
- Historical trend analysis
- Straight-line forecasting
- Percent-of-sales forecasting
- Moving averages
- Regression analysis
- Driver-based financial models
These techniques can be useful when reliable historical or operational data is available.
However, quantitative methods may become less dependable when business conditions change substantially.
Qualitative Forecasting
Qualitative forecasting uses informed judgment, market information, and expert assessments.
Examples include:
- Management estimates
- Sales team input
- Customer research
- Industry analysis
- Expert judgment
- Structured expert consensus methods
Qualitative forecasting is especially useful when historical data is limited or when the business is evaluating a new product, market, or strategy.
For example, a startup launching a new service may have no previous sales data.
Management may need to estimate customer demand using market research, sales discussions, and assumptions about conversion rates.
In practice, many businesses combine quantitative and qualitative information.
An effective forecast might use historical sales patterns as a baseline, then adjust expectations based on signed contracts, customer behavior, and current market conditions.
Financial Forecasting Methods Compared
The following table summarizes common forecasting techniques and approaches.
| Method | Best Used For | Main Limitation |
| Historical Trend | Stable businesses with consistent patterns | Assumes past patterns remain relevant |
| Straight-Line | Simple growth projections | Does not capture changing conditions well |
| Percent of Sales | Expenses linked to revenue | Not every cost moves proportionally with sales |
| Moving Average | Smoothing short-term fluctuations | Can lag behind sudden changes |
| Regression | Analyzing relationships between variables | Depends on reliable data and appropriate assumptions |
| Driver-Based | Revenue, costs, and operating performance | Requires accurate operational drivers |
| Bottom-Up or Pipeline | Project-based and sales-driven businesses | Opportunities may not convert as expected |
| Rolling Forecast | Frequently changing business conditions | Requires regular updates |
| Scenario Forecast | Evaluating uncertainty and major decisions | Depends on credible scenario assumptions |
| 13-Week Cash Forecast | Short-term liquidity | Does not replace a long-term profit forecast |
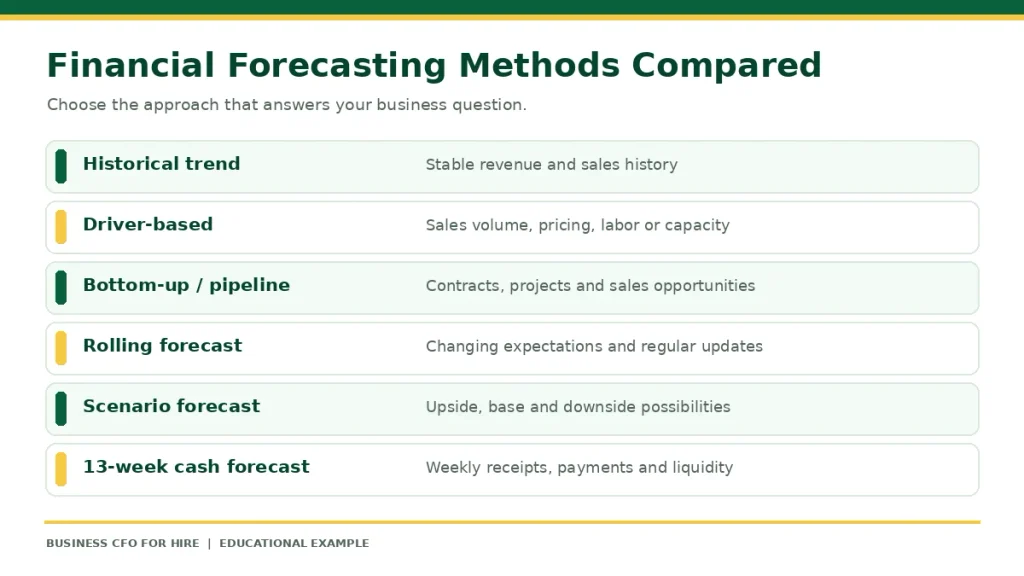
These methods are not all mutually exclusive.
For example, a company may use driver-based assumptions within a rolling forecast and create downside scenarios using the same underlying financial model.
Similarly, a 13-week cash forecast describes a forecasting purpose and time horizon rather than a separate statistical technique.
1. Historical Trend and Straight-Line Forecasting
Historical trend forecasting uses previous financial results to estimate future performance.
A simple approach applies an expected growth rate to last year’s revenue.
Forecast Revenue = Historical Revenue × (1 + Expected Growth Rate)
Suppose a company generated $5 million in revenue last year and expects 8% growth.
$5,000,000 × 1.08 = $5,400,000
The forecasted annual revenue is $5.4 million.
If the business expects its gross margin to remain at 35%, projected gross profit would be:
$5,400,000 × 35% = $1,890,000
This approach is relatively straightforward and can help establish an initial planning baseline.
When It Works Best
Historical trend forecasting may be appropriate when:
- Revenue patterns are relatively stable.
- Customer demand is predictable.
- The business model has not materially changed.
- Historical expense relationships remain relevant.
- Management needs a preliminary estimate.
Limitations
Historical trends do not explain every future change.
A major customer loss, price increase, labor shortage, or market disruption could make prior growth rates unreliable.
A business should not assume that last year’s growth will continue without evaluating current conditions.
2. Percent-of-Sales Forecasting
Percent-of-sales forecasting estimates certain expenses or financial accounts as a percentage of projected revenue.
For example, a business may observe that its direct costs have historically represented 40% of sales.
If projected revenue is $1 million, the initial forecast for direct costs would be:
$1,000,000 × 40% = $400,000
This technique can provide a simple way to forecast expenses that change with sales activity.
However, not all expenses behave this way.
Rent, certain salaries, insurance, and other fixed costs may remain relatively stable even as revenue increases or decreases.
Using one percentage for every expense category can therefore produce misleading results.
Best Application
Use percent-of-sales forecasting for expense categories with a reasonable relationship to sales.
Review fixed costs, step costs, capacity constraints, and one-time expenses separately.
3. Moving Average Forecasting
Moving average forecasting uses the average of several previous periods to estimate future results.
It can help smooth short-term fluctuations.
Suppose a business records the following monthly sales:
| Month | Revenue |
| January | $100,000 |
| February | $110,000 |
| March | $105,000 |
A three-month moving average forecast for April would be:
($100,000 + $110,000 + $105,000) ÷ 3 = $105,000
This provides a simple estimate based on recent performance.
When It Works Best
Moving averages can be useful when the business experiences moderate short-term fluctuations but no strong underlying change.
Limitations
Moving averages can lag behind rapid growth, declining demand, or seasonal shifts.
A company experiencing a major change should not rely solely on a moving average.
4. Regression Forecasting
Regression analysis examines statistical relationships between variables.
For example, a company may investigate whether sales tend to change with advertising spending, customer traffic, or another measurable factor.
A simplified linear regression model takes the form:
Forecast Outcome = Intercept + (Coefficient × Driver)
Suppose a fitted model estimates monthly revenue as:
$50,000 + (4 × Monthly Advertising Spending)
If advertising spending is expected to be $10,000:
$50,000 + (4 × $10,000) = $90,000
The illustrative model predicts $90,000 in monthly revenue.
However, a statistical relationship does not automatically establish causation.
The coefficient must be estimated from appropriate data, and management should test whether the relationship remains reliable under changing business conditions.
Regression can be useful for companies with sufficient historical data and meaningful measurable drivers.
It may be unnecessarily complex for a business that could produce a more useful forecast with a straightforward operational model.
5. Driver-Based Forecasting
Driver-based forecasting connects financial results to the underlying business activities that produce them.
Instead of simply increasing last year’s revenue by an estimated percentage, management identifies the variables that determine revenue and costs.
Common drivers include:
- Units sold
- Average selling price
- Number of customers
- Customer retention
- Billable hours
- Employee utilization
- Labor cost per hour
- Material cost per unit
- Production capacity
Driver-Based Forecasting Example
Consider a manufacturer expecting to sell 1,000 units at an average selling price of $500.
Revenue = Units Sold × Average Selling Price
1,000 × $500 = $500,000
Suppose direct material and labor costs total $325 per unit.
Direct Costs = Units Sold × Direct Cost per Unit
1,000 × $325 = $325,000
Expected gross profit is:
$500,000 − $325,000 = $175,000
Expected gross margin is:
$175,000 ÷ $500,000 × 100 = 35%
This method helps management understand why results change.
If selling prices decline or material costs increase, the company can update the relevant driver rather than rebuild the entire forecast.
When It Works Best
Driver-based forecasting is particularly useful when management can identify the main activities affecting revenue, margins, or operating costs.
It also encourages collaboration.
Sales can provide customer and pricing assumptions. Operations can evaluate production capacity. Purchasing can assess material costs. Finance can connect those assumptions to profitability and cash flow.
6. Bottom-Up and Sales Pipeline Forecasting
Bottom-up forecasting builds financial projections from individual revenue sources or operational activities.
Examples include:
- Customers
- Contracts
- Projects
- Locations
- Service engagements
- Sales opportunities
- Billable employees
This approach can be especially useful for project-based businesses and companies with concentrated revenue.
A construction company, for example, may forecast based on contract backlog, expected project schedules, costs to complete, and potential new work.
A professional services company may forecast using client engagements, billable hours, and employee utilization.
Pipeline Forecasting Example
Suppose a business has three potential sales opportunities.
| Opportunity | Potential Revenue | Estimated Win Probability | Weighted Revenue |
| A | $100,000 | 80% | $80,000 |
| B | $200,000 | 50% | $100,000 |
| C | $150,000 | 20% | $30,000 |
| Total | $450,000 | $210,000 |
The weighted sales pipeline is:
$80,000 + $100,000 + $30,000 = $210,000
This can be useful for planning, but it does not mean the business will actually recognize $210,000 in revenue.
A contract may be won or lost, and revenue recognition may occur in a different period.
Management should evaluate contract timing, delivery capacity, probability assumptions, and the difference between expected bookings, recognized revenue, and cash collections.
7. Rolling Forecasting
A rolling forecast is updated regularly and continually extends the planning horizon.
For example, a company may maintain a rolling 12-month forecast.
At the end of each month, it replaces the completed month with actual results, updates assumptions, and adds another future month.
This allows management to maintain a forward-looking view as conditions change.
Rolling Forecast vs. Annual Budget
An annual budget generally establishes a financial plan and performance benchmark.
A rolling forecast reflects management’s updated expectations.
| Annual Budget | Rolling Forecast |
| Typically approved for a defined fiscal period | Updated periodically |
| Establishes original targets | Reflects current expectations |
| Supports accountability | Supports forward-looking decisions |
| Changes usually require formal review | Adjusts as new information becomes available |
Suppose the annual budget assumes $3 million in revenue.
After four months, management learns that a major customer will reduce purchases.
The original budget still shows the approved goal.
The rolling forecast incorporates the expected decline and helps management evaluate potential spending changes.
When It Works Best
Rolling forecasts are particularly useful for growing businesses, companies experiencing changing market conditions, and organizations that need frequent financial decisions.
The process should focus on material changes rather than repeatedly rebuilding every financial assumption.
8. Scenario Forecasting
Scenario forecasting evaluates multiple possible outcomes rather than relying on one estimate.
Common scenarios include:
- Base case
- Upside case
- Downside case
The objective is to identify how different business conditions may affect profitability, cash flow, and funding requirements.
Scenario Forecasting Example
Consider a service business with the following projected annual results.
| Metric | Downside | Base Case | Upside |
| Revenue | $900,000 | $1,000,000 | $1,100,000 |
| Variable Costs at 40% | $360,000 | $400,000 | $440,000 |
| Fixed Operating Costs | $500,000 | $500,000 | $500,000 |
| Operating Profit | $40,000 | $100,000 | $160,000 |
Under the base case, operating profit is $100,000.
If revenue falls by 10% while the stated cost assumptions hold, operating profit falls to $40,000.
A 10% revenue reduction therefore causes a 60% decrease in operating profit in this hypothetical example.
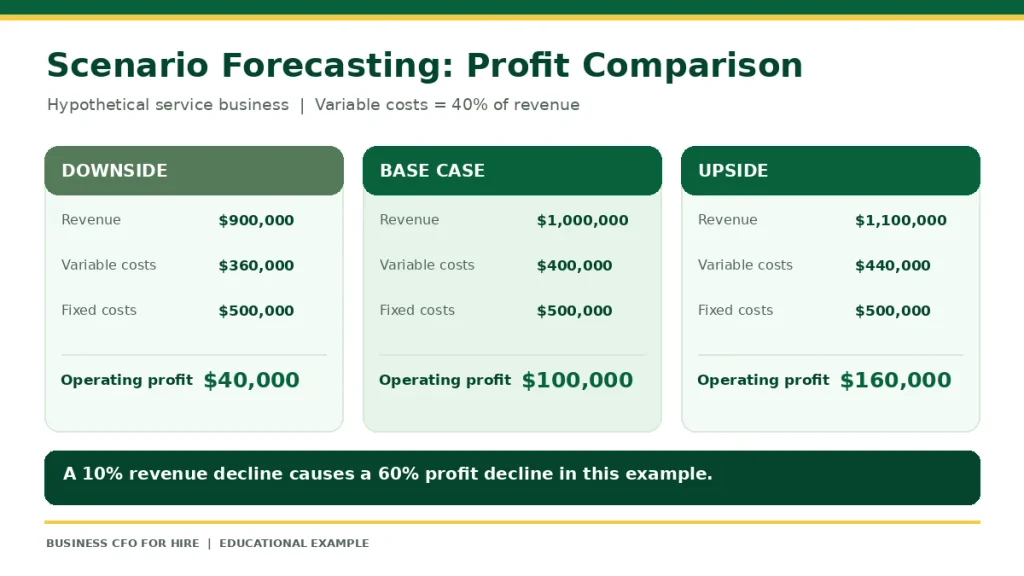
This happens because fixed operating costs remain unchanged.
Why Scenario Forecasting Matters
The analysis helps management evaluate whether the business can withstand less favorable conditions.
For example, a company considering additional debt should assess whether repayment remains manageable if revenue declines.
Scenarios should reflect realistic combinations of business conditions rather than changing only revenue while overlooking other important factors.
9. The 13-Week Cash Flow Forecast
A 13-week cash flow forecast focuses on near-term liquidity.
It estimates expected cash receipts and payments over the coming 13 weeks, generally using weekly periods.
Common inputs include:
- Beginning available cash
- Expected customer collections
- Payroll
- Vendor payments
- Rent
- Taxes
- Debt payments
- Planned capital expenditures
This forecast answers a different question from an income statement projection.
Will the business have enough cash to meet its obligations when they become due?
Simplified Cash Forecast Example
Consider the following illustrative forecast.
| Period | Beginning Cash | Receipts | Payments | Ending Cash |
| Weeks 1–4 | $80,000 | $120,000 | $140,000 | $60,000 |
| Weeks 5–8 | $60,000 | $100,000 | $125,000 | $35,000 |
| Weeks 9–13 | $35,000 | $150,000 | $120,000 | $65,000 |
The forecast suggests that the lowest projected cash balance at these period endpoints is $35,000.
However, this four-to-five-week summary is not a substitute for an actual weekly forecast. Cash could fall lower between the displayed dates.
Management should review individual weekly balances and compare the lowest projected cash level with its minimum operating requirement.
If the company needs to maintain at least $50,000 in available cash, the projected $35,000 balance indicates a potential $15,000 shortfall against that target.
The business may need to review customer collections, payment timing, spending plans, or financing options.
For a more detailed discussion of liquidity planning, see How Much Cash Should a Business Have on Hand?.
How to Choose the Right Financial Forecasting Method
Choosing the appropriate method begins with identifying the decision management needs to make.
| Business Situation | Recommended Starting Approach |
| Stable revenue and simple annual planning | Historical trend or straight-line forecast |
| Expenses closely tied to sales | Percent-of-sales forecast |
| Short-term fluctuations | Moving average |
| Strong relationships between measurable variables | Regression analysis |
| Revenue depends on operational activity | Driver-based forecast |
| Business relies on contracts and projects | Bottom-up or pipeline forecast |
| Business conditions change frequently | Rolling forecast |
| Major investment or uncertain economic conditions | Scenario forecast |
| Immediate cash-flow pressure | 13-week cash flow forecast |
A growing company may use several approaches together.
For example, a professional services business could build a driver-based revenue forecast using expected billable hours and utilization.
It could update that forecast monthly, prepare downside scenarios for hiring decisions, and maintain a weekly cash forecast to monitor payroll and customer collections.
The purpose is not to select the most sophisticated method.
It is to select the method that provides reliable information for the decision being made.
How to Build a Reliable Financial Forecast
Even an appropriate forecasting technique can produce poor results when the underlying information is inaccurate.
A reliable forecasting process should follow several steps.
Step 1: Define the Business Question
Determine whether the forecast is intended to support hiring, expansion, financing, cash management, or another decision.
Step 2: Select the Forecast Horizon
A short-term cash forecast may use weekly periods.
Operating forecasts may use monthly periods.
Strategic forecasts may extend several years, depending on the decision.
Longer forecast horizons generally involve greater uncertainty.
Step 3: Gather Reliable Information
Review historical financial statements, current contracts, sales pipelines, operating measures, and other relevant data.
Investigate material errors and unusual transactions before using the information.
Step 4: Identify the Main Assumptions
Document assumptions involving pricing, customer demand, costs, payroll, collections, and other important drivers.
Assign responsibility for validating assumptions where possible.
Step 5: Build the Financial Model
Estimate future revenue, expenses, profit, and cash flow using the selected methods.
Where necessary, connect projected income statements, balance sheets, and cash flow statements.
Step 6: Evaluate Alternative Outcomes
Test major assumptions using downside and upside scenarios.
Identify the financial consequences of lower revenue, higher costs, or delayed collections.
Step 7: Compare Actual Results With the Forecast
Review actual performance regularly and investigate material differences.
Step 8: Update and Use the Forecast
Revise assumptions when evidence changes.
Use the forecast to support decisions rather than treating it as a report that simply needs to be completed.
How to Measure Financial Forecast Accuracy
Forecast accuracy should be evaluated because it helps identify unreliable assumptions.
A simple approach is to compare forecasted and actual results.
Forecast Error = Actual Amount − Forecast Amount
Suppose management forecasts $100,000 in monthly revenue but actual revenue is $92,000.
Forecast error:
$92,000 − $100,000 = -$8,000
The forecast overestimated revenue by $8,000.
A simple absolute percentage error calculation is:
Absolute Percentage Error = |Actual − Forecast| ÷ |Actual| × 100
$8,000 ÷ $92,000 × 100 = 8.7%
This indicates an absolute percentage error of approximately 8.7% under that definition.
Absolute percentage error is undefined when the actual value is zero and can become misleading when actual amounts are very small.
Businesses should use error measures appropriate to their data and reporting purpose.
What Management Should Investigate
The next step is not merely calculating the error.
Determine whether the difference resulted from:
- Incorrect sales assumptions
- Customer losses
- Delayed projects
- Pricing changes
- Unexpected expenses
- Accounting timing differences
- Changes in market conditions
Recurring forecasting errors may indicate a need to improve the forecasting method or underlying data.
The objective is to improve decision-making, not to demand perfect forecasts.
Financial Forecasting vs. Budgeting vs. Financial Modeling
These concepts are closely related but not interchangeable.
Budgeting establishes a financial plan, spending expectations, and performance targets.
Financial forecasting estimates what management now expects to happen based on available information.
Financial modeling uses structured calculations and assumptions to evaluate financial relationships, scenarios, and decisions.
For example, a company might approve an annual hiring budget.
Its rolling forecast could later show lower expected revenue.
A financial model could then evaluate the impact of delaying certain hires.
Together, these tools help management balance accountability with adaptability.
Can AI Improve Financial Forecasting?
AI and advanced analytics can assist financial forecasting by identifying patterns, detecting anomalies, and processing large datasets.
Potential applications include:
- Analyzing historical trends
- Identifying unusual transactions
- Preparing preliminary projections
- Comparing scenarios
- Supporting reporting workflows
- Highlighting potential forecast errors
However, AI-generated forecasts are not automatically more accurate than simpler approaches.
Their reliability depends on data quality, model design, changing business conditions, and appropriate human oversight.
A sophisticated model cannot compensate for incorrect accounting records, unrealistic sales assumptions, or missing operational information.
Business owners should evaluate forecasting technology based on its usefulness, transparency, cost, and ability to support actual decisions.
For many smaller companies, a well-maintained spreadsheet with reliable assumptions may be more practical than an expensive system that nobody understands or updates.
Common Financial Forecasting Mistakes
Assuming Historical Growth Will Continue
Past performance may provide useful context, but forecasts should reflect current customer demand, pricing, operating conditions, and market changes.
Confusing Revenue With Cash Collections
A projected sale is not the same as cash in the bank.
Cash flow forecasts must consider actual payment timing.
Using One Method for Every Decision
An annual profit forecast cannot replace a short-term cash forecast, and a pipeline estimate cannot fully explain working capital requirements.
Overcomplicating the Model
More formulas and worksheets do not necessarily produce more reliable information.
A simpler forecast with well-supported assumptions may be easier to maintain and use.
Ignoring Operating Capacity
A sales forecast may assume revenue growth that staffing, equipment, or production capacity cannot support.
Failing to Update Assumptions
A forecast becomes less useful when it continues relying on outdated information.
Treating the Forecast as a Guarantee
Forecasts should acknowledge uncertainty and help management prepare for possible outcomes.
Failing to Assign Ownership
Sales, operations, purchasing, and finance should contribute information relevant to their responsibilities.
A forecast developed entirely without operational input may miss important business constraints.
How a Fractional CFO Supports Financial Forecasting
Business owners often need financial forecasts but lack the time or specialized expertise to develop and maintain them.
A fractional CFO can help determine which forecasting methods are appropriate for the company’s business model and decisions.
Depending on the engagement, this may include:
- Evaluating historical financial performance
- Improving financial reporting reliability
- Identifying operational revenue and cost drivers
- Developing rolling forecasts
- Preparing short-term cash flow projections
- Evaluating growth and financing scenarios
- Reviewing forecast accuracy
- Establishing accountability for financial assumptions
- Connecting financial forecasts with strategic decisions
The objective is not simply to produce a more detailed spreadsheet.
It is to help management understand future financial requirements and make more informed decisions.
Business CFO For Hire provides fractional CFO services to help growing businesses improve financial visibility, forecasting, and strategic planning.
Frequently Asked Questions About Financial Forecasting Methods
What are the main financial forecasting methods?
Common methods include historical trend analysis, straight-line forecasting, percent-of-sales forecasting, moving averages, regression, driver-based forecasting, and bottom-up forecasting. Businesses also use rolling forecasts, scenario planning, and cash flow forecasting approaches.
What is the best financial forecasting method for small businesses?
There is no universal best method. Businesses with stable operations may begin with historical trends, while growing companies may benefit from driver-based rolling forecasts and short-term cash projections.
What is the difference between quantitative and qualitative forecasting?
Quantitative forecasting relies on numerical data and statistical techniques. Qualitative forecasting incorporates expert judgment, market research, and other nonhistorical information.
What is driver-based financial forecasting?
Driver-based forecasting projects financial results using the activities that generate revenue and costs, such as units sold, pricing, labor hours, or customer volume.
What is a rolling financial forecast?
A rolling forecast is updated periodically and extends the planning horizon as new actual results and business information become available.
What is scenario forecasting?
Scenario forecasting evaluates different possible outcomes using changes in assumptions such as revenue, expenses, pricing, collections, or business activity.
What is a 13-week cash flow forecast?
A 13-week cash flow forecast estimates expected cash receipts, payments, and balances over 13 weeks to help management monitor near-term liquidity.
How often should financial forecasts be updated?
The appropriate frequency depends on the business and forecast type. Many companies update operating forecasts monthly, while cash-constrained businesses may need weekly cash forecasting.
How do you measure financial forecast accuracy?
Compare actual results with forecasted amounts, investigate significant differences, and use appropriate error measures to determine whether forecasting assumptions need improvement.
Can financial forecasting predict business performance accurately?
Forecasting can support useful estimates, but actual outcomes may differ because of changing business conditions and uncertainty. Regular updates, reliable information, and realistic assumptions improve its usefulness.
Final Thoughts: Choose Forecasting Methods That Support Better Decisions
Financial forecasting is not about predicting the future perfectly.
It is about preparing for the decisions a business will face.
Historical trends can establish a useful baseline. Driver-based forecasts can explain the activities behind revenue and costs. Rolling forecasts help management adapt to changing conditions, while scenario planning evaluates uncertainty.
A 13-week cash forecast can reveal near-term liquidity problems that a traditional profit projection may overlook.
The most effective approach often combines several methods.
However, the value of a forecast does not come from spreadsheet complexity.
It comes from reliable assumptions, regular updates, and the ability to turn financial information into action.
The most important question is not which forecasting method is the most sophisticated. It is which method best supports the decision your business needs to make.
If your company needs stronger financial forecasts, improved cash flow visibility, or guidance evaluating growth decisions, experienced financial leadership can help.
Schedule a free CFO strategy call with Business CFO For Hire to discuss your financial planning priorities.