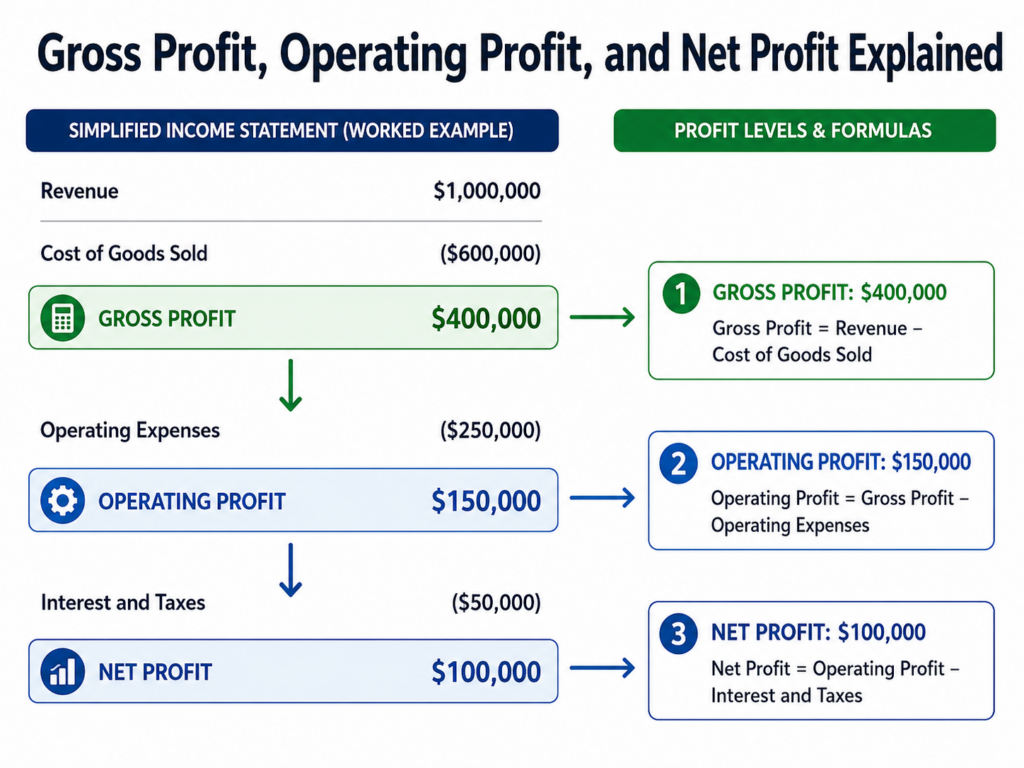
Gross profit is revenue minus the direct cost of producing what you sell. Operating profit is calculated by subtracting your operating expenses from that. Net profit subtracts everything else: interest, taxes, and any non-operating costs, leaving what’s actually left over. Each one answers a different question, and reading them together tells you more than any single number alone.
Most businesses check net profit and stop there. That’s the mistake this guide is built to fix.
Key takeaways
- Gross profit = Revenue − Cost of Goods Sold. It measures how efficiently you produce and price what you sell, before anything else is factored in.
- Operating profit = Gross Profit − Operating Expenses. It shows how efficiently the business runs day to day, independent of debt and taxes.
- Net profit = Operating Profit − Interest − Taxes (and other non-operating items). It’s the true bottom line: what’s actually left for the owner.
- The gap between your margins is diagnostic: a shrinking gap between gross and operating margin points to overhead, while a healthy operating margin eroded by the drop to net points at debt or tax structure instead.
- All three numbers appear on a standard income statement, in that order, which is exactly why comparing them side by side is worth doing every month, not just at tax time.
What is gross profit?
Gross profit is the money left over after subtracting the direct cost of producing what you sell — your cost of goods sold — from total revenue. The formula is Gross Profit = Revenue − COGS, and the resulting gross margin (gross profit divided by revenue) measures how efficiently your pricing and production actually work.
Gross profit doesn’t touch rent, salaries for non-production staff, marketing, interest, or taxes. It answers one narrow question: for every dollar of sales, how much is left after directly making or delivering the product? That narrowness is a feature, not a limitation — it’s the cleanest read on whether your core pricing and production model actually works.
What is operating profit?
Operating profit is gross profit minus your operating expenses — rent, salaries, marketing, software, and other costs of running the business day to day, before interest and taxes. The formula is Operating Profit = Gross Profit − Operating Expenses, sometimes labeled EBIT (earnings before interest and taxes) on a formal income statement.
This is the number that shows how efficiently the business is actually run, separate from how it’s financed or taxed. Two businesses with identical gross margins can show very different operating margins, because one runs lean on overhead and the other doesn’t. Operating profit is where that difference becomes visible.
What is net profit?
Net profit is what’s left after subtracting everything from revenue — cost of goods sold, operating expenses, interest, and taxes. The formula is Net Profit = Operating Profit − Interest − Taxes, and it’s the true bottom line: what the business actually kept, once every obligation is accounted for.
Net profit is the number lenders, investors, and the IRS all care about most, because it reflects the complete financial reality rather than a partial view. It’s also the number most vulnerable to distortion from one-time events — a large tax adjustment or an unusual interest expense can swing net profit in a way that has nothing to do with how the core business actually performed that month.
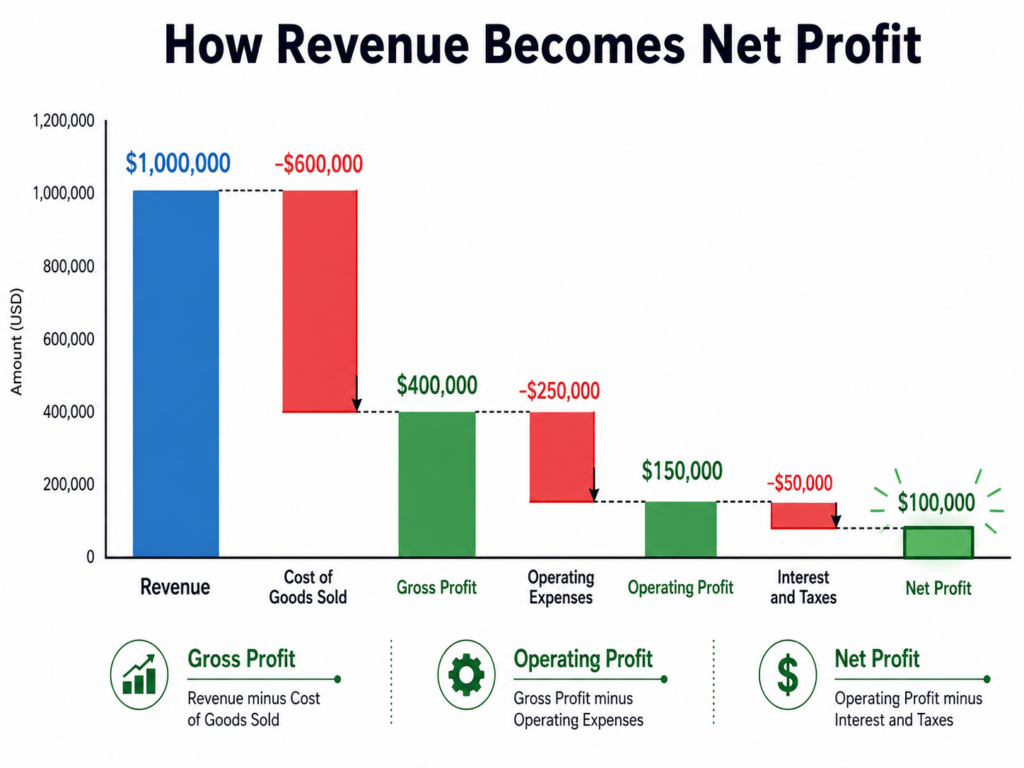
Gross profit vs. operating profit vs. net profit: formulas and margins
Each tier subtracts one more layer of cost, and each margin answers a narrower, more complete question than the one before it.
| Gross profit | Operating profit | Net profit | |
| Formula | Revenue − COGS | Gross Profit − Operating Expenses | Operating Profit − Interest − Taxes |
| Margin | Gross Profit ÷ Revenue | Operating Profit ÷ Revenue | Net Profit ÷ Revenue |
| What it measures | Production and pricing efficiency | Day-to-day operational efficiency | True bottom-line profitability |
| Excludes | Everything except direct production cost | Interest, taxes, non-operating items | Nothing — it’s the full picture |
| Best used for | Pricing decisions, product-line viability | Overhead and operational discipline | Overall financial health, lender and investor review |
A full worked example: one income statement, three margins
Numbers make the sequence clear. Take a $5 million marketing and creative services agency.
| Line item | Amount | Margin |
| Revenue | $5,000,000 | — |
| Cost of goods sold (direct production labor, project costs) | ($2,100,000) | — |
| Gross profit | $2,900,000 | 58.0% |
| Operating expenses (rent, admin salaries, marketing, software) | ($2,200,000) | — |
| Operating profit | $700,000 | 14.0% |
| Interest expense | ($60,000) | — |
| Taxes | ($160,000) | — |
| Net profit | $480,000 | 9.6% |
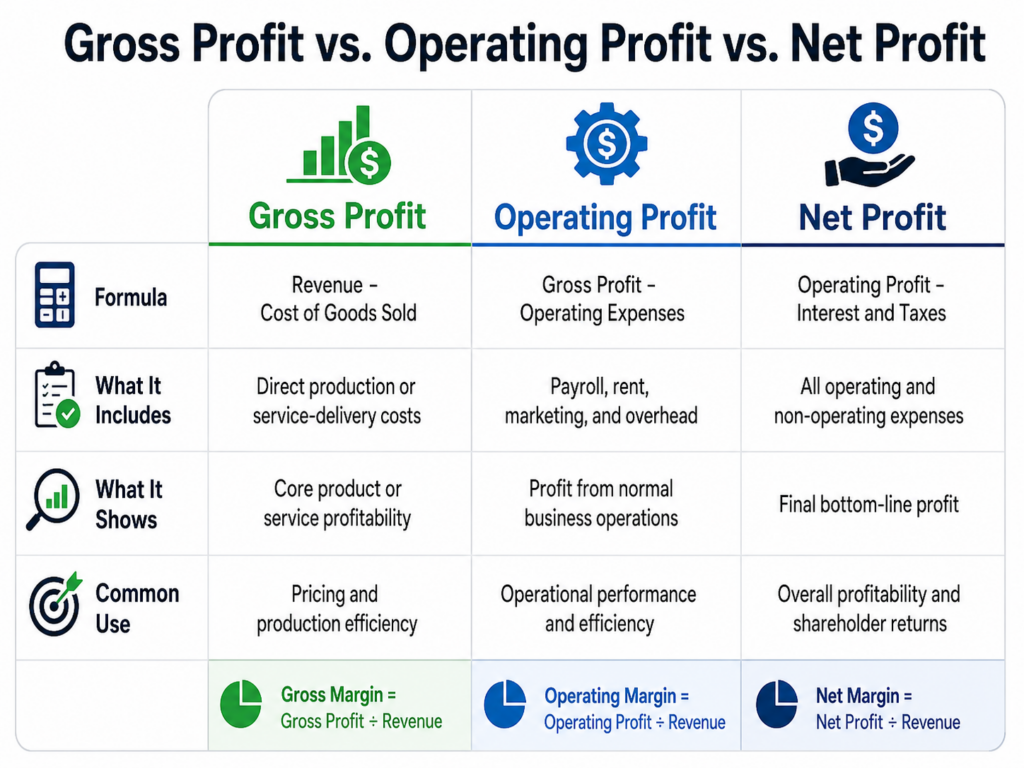
Reading top to bottom: this agency keeps 58 cents of every dollar after direct production costs, a genuinely strong gross margin. By the time overhead is factored in, that drops to a 14% operating margin — a meaningful step down, worth watching but not alarming for a services business. Net profit lands at 9.6% after interest and taxes, a healthy final result. The story the numbers tell: pricing and production are working well; the bigger opportunity, if there is one, sits in operating expenses, not in what the agency charges clients.
What the gap between your margins actually tells you
The size of the gap between each margin tells you where to look for a problem, which is more useful than any single number in isolation. A shrinking gap between gross margin and operating margin points to overhead — too much spent running the business relative to what it produces. A healthy operating margin that erodes sharply on the way to net points somewhere else entirely: debt load, interest rates, or tax structure.
In 30-plus years of CFO work, the pattern Stan Alhadeff sees most often is an owner who watches net profit shrink and assumes the business itself is getting less efficient, when the real story is sitting one line above — pricing held steady, production stayed efficient, and a new loan or a bad year for taxes did all the damage. Reading the three margins together, not just the bottom line, is what catches that distinction. For a fuller picture of how this fits into the rest of your income statement, balance sheet, and cash flow statement, all three margins live on the same document you’re likely already generating monthly.
Common mistakes when comparing these numbers
The most common mistake is checking only net profit and treating it as the whole story, when a healthy gross margin with a weak net margin is telling you something specific and fixable. A second mistake is comparing margins across very different business types — a services business and a manufacturer will structurally show different gross margins even when both are run equally well, so the comparison that matters is your own trend over time, not a number from an unrelated industry.
A third mistake is reacting to a single month’s numbers instead of the pattern. One month’s spike in interest expense or a one-time tax adjustment can distort net profit without reflecting anything real about how the business is actually performing. If you want a clear read on which of your own margins deserves attention first, our free discovery call includes a GAP Analysis that shows you plainly.
Which margin matters most for your next decision
The right margin to focus on depends on the decision in front of you, not a general rule about which one is “most important.” Pricing or product-line decisions belong with gross margin. Questions about overhead, staffing, or operational discipline belong with operating margin. Decisions about financing, debt, or overall financial health belong with net margin.
Stan Alhadeff worked with one client, Amerigo Metal Recycling, through more than a decade of growth from $8 million to nearly $50 million in revenue, watching all three margins move together and separately at different points in that growth — sometimes a pricing fix, sometimes an overhead conversation, sometimes a financing decision, depending on which gap was actually widening that year.
Reading all three, every month
None of these three numbers was built to stand alone. Gross profit tells you if your pricing and production work. Operating profit tells you if the business runs efficiently day to day. Net profit tells you the real bottom line once everything else is accounted for. Read only one, and you’re missing at least a third of the picture.
If you’d like a straight read on what your own margins are telling you, book a free strategy call with Stan — it starts with a look at your actual numbers, not a generic benchmark.
FAQ
What is the difference between gross profit and net profit? Gross profit is revenue minus the direct cost of producing what you sell, while net profit subtracts everything — operating expenses, interest, and taxes — to show what’s actually left over. Gross profit measures production and pricing efficiency; net profit measures overall financial health.
What is operating profit? Operating profit is gross profit minus operating expenses such as rent, salaries, and marketing, calculated before interest and taxes are deducted. It’s sometimes called EBIT, and it measures how efficiently a business runs day to day, separate from how it’s financed or taxed.
How do you calculate net profit margin? Net profit margin is calculated by dividing net profit by total revenue, then expressing the result as a percentage. Net profit itself equals operating profit minus interest expense and taxes.
Which is more important, gross profit or net profit? Neither is more important on its own — they answer different questions. Gross profit shows whether pricing and production are working, while net profit shows whether the business is genuinely profitable once every cost is included.
What does a big gap between gross and net profit mean? A large gap between gross and net profit usually means operating expenses, interest, or taxes are consuming a significant share of what the business produces. Checking operating profit specifically helps identify whether overhead or financing costs are the bigger driver of that gap.

Stan Alhadeff
Founder & Fractional CFO