Leadership accountability is the practice of leaders taking full ownership of business outcomes — financial, operational, and cultural — rather than attributing results to external forces. It is not a soft skill or a values-poster virtue. From the CFO’s seat, it is a measurable financial variable, and one of the most reliably predictive ones available. Long before weak accountability becomes a visible crisis, it shows up in the numbers: in cash flow strain, revenue volatility, margin compression, and the quiet operational decay that compounds until it can’t be ignored.
Shensi Ding, co-founder of Merge, put the personal version bluntly: “Your life is your fault.” The business translation is just as unambiguous. Your company’s outcomes are the direct result of leadership actions, decisions, and deliberate indecisions. When executives point elsewhere — at the bank, the market, a regulator, a supply chain partner — they build a false narrative. And that narrative never stays in the conference room. It finds its way into the financial statements.
This guide shows you exactly where. You’ll get the data behind the accountability crisis, a map of how specific excuses land on specific financial line items, three formulas to price your own accountability gap, a measurement scorecard, and the framework that closes the gap — including when it makes sense to bring in outside financial leadership to install it.

Key Takeaways
- Creating accountability is the single weakest leadership competency measured. In Gallup’s 2026 research on seven core leadership competencies, it ranked last — and fewer than half of leaders rate themselves as strong at it.
- The perception gap is enormous. Managers rate their leaders’ abilities 20+ percentage points lower than leaders rate themselves.
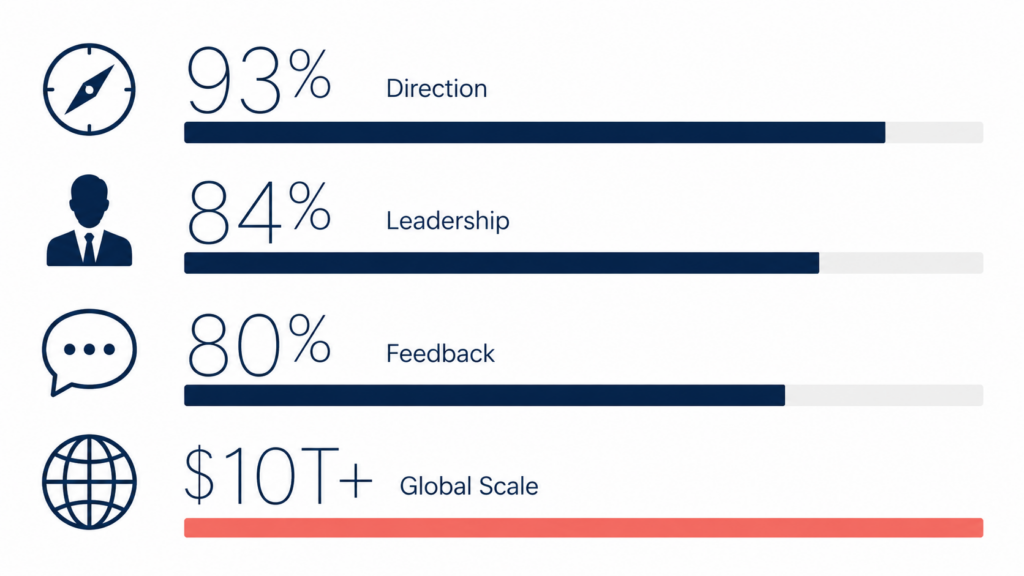
- The downstream cost is staggering. Gallup’s 2026 State of the Global Workplace pegs annual productivity lost to disengagement at more than $10 trillion — roughly 9% of global GDP — and leader behavior is the #1 driver employees cite.
- Accountability gaps are quantifiable. Using the formulas in this guide, a typical $10M company can trace roughly 15–20% of EBITDA to unowned variances, delayed decisions, and preventable churn.
- The fix is financial infrastructure, not motivational posters: single-owner P&L lines, rolling forecasts, variance reviews with named owners, and a leadership scorecard — the exact system a [LINK: fractional CFO → /cfo-services/] installs at 60–80% less than a full-time hire.
What Is Leadership Accountability?
Leadership accountability means a leader answers for results — not just effort, and not just their own tasks. An accountable leader owns the outcome of every decision they made, every decision they delayed, and every risk they chose not to plan for, regardless of how much of the execution sat with other people.
That last clause is where most definitions go soft. Responsibility can be delegated; accountability cannot. You can assign the forecasting work to a controller. You cannot assign away being the person who answers for a cash crunch the forecast should have caught.
Accountability vs. Responsibility vs. Ownership
| Concept | Core question | Can it be delegated? | When it operates |
| Responsibility | Who does the work? | Yes — tasks are assigned | Before and during execution |
| Accountability | Who answers for the result? | No — one name per outcome | Before, during, and after |
| Ownership | Who behaves as if the outcome is theirs? | Can’t be assigned — only modeled | Continuously |
A useful CFO shorthand: responsibility lives in job descriptions, accountability lives in the variance report, and ownership lives in how people behave when nobody is checking the variance report.
Leadership Accountability by the Numbers
The research on this is unusually consistent — and unusually bleak.
| Finding | Figure | Source |
| Rank of “create accountability” among 7 core leadership competencies | Lowest-rated | Gallup, 2026 |
| Leaders who rate themselves outstanding or exceptional at creating accountability | Under 50% | Gallup, 2026 |
| Gap between leaders’ self-ratings and how managers rate those same leaders | 20+ points | Gallup, 2026 |
| Employees who say feedback arrives only when something goes wrong — or never | 80% | Workplace Accountability Study (40,000 participants) |
| Employees unsure what their organization is even trying to achieve | 85% | Workplace Accountability Study |
| Workers unable to connect their daily work to desired results | 93% | Workplace Accountability Study |
| Employees naming leader behavior as the single biggest driver of accountability | 84% | Workplace Accountability Study |
| Employees who say weak accountability drains morale | 87% | HR industry survey data |
| Global employee engagement (a five-year low) | 20% | Gallup, State of the Global Workplace 2026 |
| Annual global productivity lost to disengagement | $10+ trillion (~9% of global GDP) | Gallup, 2026 |
Read those together and the causal chain is hard to miss: leaders are weakest at exactly the competency employees say matters most, the resulting confusion leaves nine in ten workers disconnected from results, and the aggregate bill runs to trillions. The only question for an individual company is what its share of that bill looks like — which is what the rest of this article quantifies.
How Accountability Failures Show Up in Financial Statements
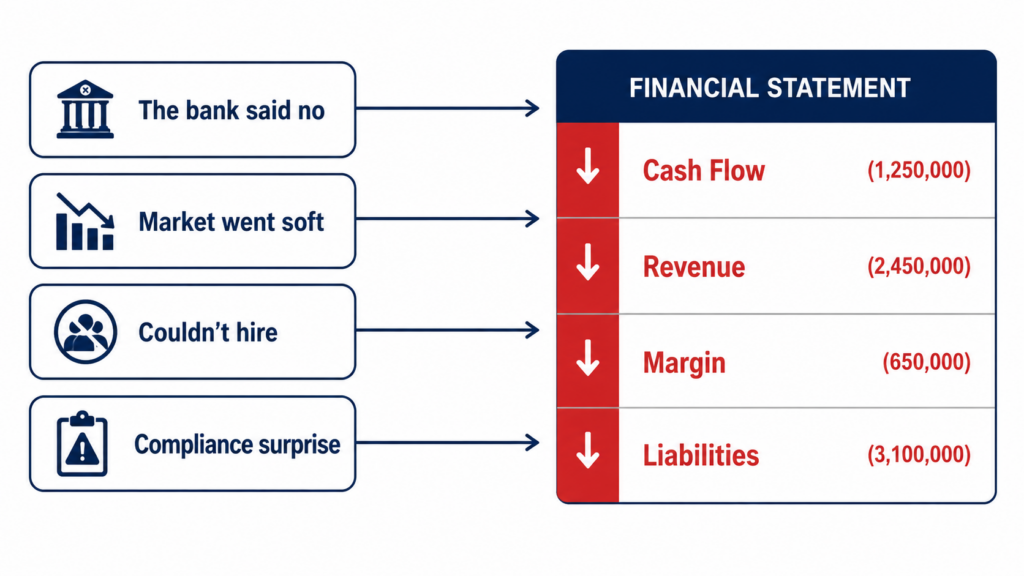
Every excuse has a financial address. Here is the map, followed by the four patterns a CFO sees most often.
The Excuse-to-Balance-Sheet Map
| The excuse in the boardroom | The actual root cause | Where it lands first | Metrics that degrade |
| “The bank pulled our line of credit.” | Weak 13-week forecasting, late financials, a thin lender package | Cash flow statement | Days cash on hand, current ratio, DSO |
| “The market went soft.” | Passive pipeline, no prospecting cadence, founder stopped selling | Revenue line | Pipeline coverage, win rate, revenue growth % |
| “We couldn’t hire fast enough.” | Investment decisions deferred for two quarters | Operating expenses → gross margin | Churn rate, utilization, CAC payback |
| “Compliance blindsided us.” | Risk planning skipped as “someone else’s job” | Contingent liabilities | Legal expense, insurance premiums, audit findings |
1. Cash flow strain
Cash trouble is usually the earliest signal. When leadership says the bank refused to extend credit, the real story almost always sits in-house: forecasts that couldn’t survive scrutiny, liquidity managed by gut feel, documentation that wasn’t prepared to the standard lenders require. The price gets paid in payroll stress, stretched vendor payments, and credibility with lenders that takes years to rebuild. Banks don’t decline businesses randomly; they decline businesses that can’t demonstrate control.
2. Revenue volatility
Blaming market conditions when sales flatten is a leadership failure wearing an economics costume. Founders who own pipeline development — who prospect on a cadence, create momentum through disciplined activity, and treat revenue as an input they control — produce visibly different growth curves than founders who wait for demand to show up. The difference lands on the revenue line with remarkable consistency, and it separates companies within the same market conditions.
3. Operational fallout
Financial shortfalls born of inaction force reactive cuts: hiring freezes, deferred maintenance, underfunded budgets. Each excuse becomes a physical wound. A delayed investment in customer success compounds churn. Churn bleeds renewal revenue. Lost renewals force cost-cutting that further degrades the customer experience. The loop is self-reinforcing — and entirely traceable to the original failure to own a decision on time.
4. Risk concentration
Deflected accountability produces inadequate risk planning almost mechanically. Whether the exposure is regulatory compliance, credit controls, or trust-accounting obligations, skipping proactive measures on the theory that “someone else was responsible” leaves the business open to fines, litigation, and reputational damage that no later investment fully repairs. On the balance sheet, this shows up late and ugly: legal reserves, contingent liabilities, and insurance costs that reprice the whole risk profile.
The Cost of the Accountability Gap: 3 Formulas
You cannot manage what you refuse to price. These three formulas turn “we have an accountability problem” into a dollar figure a leadership team can’t argue with.
Formula 1: Variance Ownership Rate (VOR)
The fastest diagnostic. Pull last quarter’s variance report and count.
VOR = (Material variances with a named owner AND a corrective action plan ÷ Total material variances) × 100
Benchmark: 90%+ is healthy. Below 60% means variances are being explained, not owned — the bookkeeping signature of an excuse culture.
Example: 14 material variances flagged last quarter; 6 have a named owner and an action plan. VOR = 6 ÷ 14 = 43%. That number is the accountability gap made visible.
Formula 2: Decision-Delay Cost
Indecision is a decision, and it has a daily rate.
Decision-Delay Cost = (Annual contribution margin at risk ÷ 365) × Days of delay
Example: A pricing decision affecting $250,000 of annual contribution margin sits in “let’s revisit next month” purgatory for 60 days. Cost = ($250,000 ÷ 365) × 60 = $41,096 — before anyone did anything wrong except wait.
Formula 3: Accountability Gap Cost (AGC)
The full quarterly or annual tally.
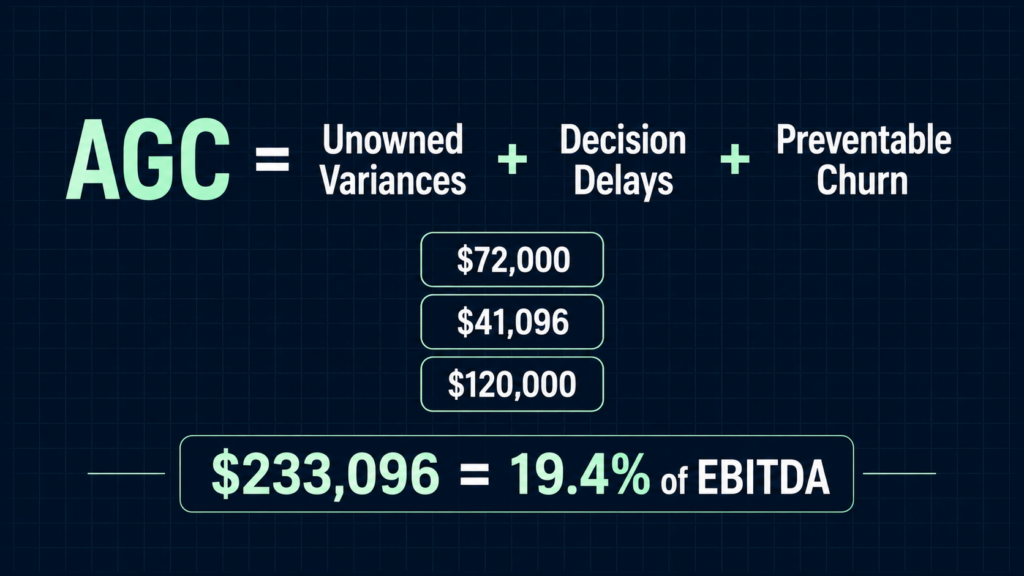
AGC = Σ (Unowned recurring variances × Months unaddressed) + Decision-delay costs + Preventable attrition & churn costs
Worked example: a $10M company
| Accountability failure | The math | Annual cost |
| Freight cost overrun nobody owns | $12,000/month × 6 months unaddressed | $72,000 |
| Pricing decision delayed | ($250,000 ÷ 365) × 60 days | $41,096 |
| Churn from underfunded customer success | 4 accounts × $30,000 | $120,000 |
| Total Accountability Gap Cost | $233,096 |
On a 12% EBITDA margin ($1.2M), that’s 19.4% of EBITDA — gone not to competition, not to macro conditions, but to outcomes nobody’s name was attached to. At a typical 4–6× EBITDA valuation multiple, the same gap quietly erases $930,000 to $1.4 million of enterprise value.
How to Measure Leadership Accountability: The CFO Scorecard
Accountability stops being abstract the moment it’s on a scorecard. These six metrics are the ones I put in front of leadership teams, with the formulas and the ranges that separate healthy from broken.
| Metric | Formula | Healthy range | What it actually tells you |
| Variance Ownership Rate | (Owned variances ÷ total material variances) × 100 | ≥ 90% | Whether results have names attached |
| Forecast Accuracy | 1 − (|Actual − Forecast| ÷ Forecast) | Within ±5–10% | Whether leaders own their numbers before the month, not after |
| Days to Close the Books | Business days from period end to final statements | ≤ 10 (SMB); ≤ 5 best-in-class | Whether anyone is accountable for information speed |
| Corrective-Action Completion | On-time closed actions ÷ actions opened | ≥ 85% | Whether “we’ll fix it” means anything |
| Repeat-Variance Rate | Recurring variance types ÷ total variances | ≤ 15% | Whether problems get solved once or explained monthly |
| Commitment Hit Rate | Commitments delivered ÷ commitments made | ≥ 90% | The said-to-did ratio — the purest accountability measure there is |
Run this scorecard monthly for two quarters and you’ll know more about your leadership team than any 360 review will tell you. The numbers don’t have feelings about who’s likable.
Leadership Accountability Examples: Before and After
Example 1: The “bank’s fault” credit line
Before: A $7M distributor is declined for a line increase. Leadership blames a conservative bank and starts factoring receivables at a cost of roughly $60,000 a year. After: A 13-week cash flow forecast, monthly closes inside ten days, and a proper lender package go to the same bank two quarters later. The line is approved. Same company, same bank, same market — the only variable that changed was whether leadership owned the lender relationship or outsourced the blame for it.
Example 2: The “soft market” revenue miss
Before: Sales flatten and the narrative becomes macro conditions. Pipeline coverage quietly sits at 1.4× quota. After: The CEO takes personal ownership of top-of-funnel activity: 15 outreach touches a week, pipeline reviewed against a 3× coverage standard, win rates tracked by owner. Four months later revenue is growing 11% in the same market the excuse said was impossible. The market didn’t change. The ownership did.
Example 3: The churn spiral
Before: A software company defers a $90,000 customer success hire for three quarters — “not the right time.” Gross revenue retention slides from 91% to 84%, costing about $210,000 in renewals. The lost revenue then becomes the reason the hire “can’t be afforded,” completing the loop. After: A CFO-led review prices the delay (Formula 2), the hire is made, and retention recovers to 90% within a year. The excuse cost 2.3× more than the decision it avoided.
The Cultural Cascade: Why Accountability Failures Never Stay at the Top
Accountability failures don’t stay contained at the executive level. They replicate. When senior leaders deflect ownership, the organization watches — and learns. Sales blames marketing. Operations blames finance. Finance blames vendors. What should be one company driving aligned objectives becomes a set of silos reinforcing each other’s excuses.
The research backs the mechanism: 84% of employees say the way leaders behave is the single most important factor in whether they hold themselves accountable, and 80% say feedback only shows up when something has already gone wrong. In other words, the excuse culture isn’t a morale problem that eventually touches finance. It’s a replication engine — and the P&L is where the copies get filed.
From the CFO’s chair, this is more damaging than a bad quarter. A bad quarter is a data point. A culture of deflection is a structural defect that makes every subsequent problem harder to solve than it should be. The inverse is equally true: ownership compounds. Ownership in sales produces revenue consistency. Ownership in operations produces efficiency. Ownership in finance preserves resilience. Stack those for eight quarters and you have a company that navigates volatility instead of being narrated by it.
How to Build Leadership Accountability: A 5-Step Framework
Accountability isn’t installed with a speech. It’s installed with infrastructure. Here is the system, in the order it should be built.
Step 1 — Give every P&L line a single owner. Not a committee, not a department: one name per revenue line, margin line, and major expense category. If two people own a number, nobody does. This is a one-page exercise that surfaces every “I thought that was theirs” gap in the company.
Step 2 — Replace opinions with a rolling 13-week cash forecast. A live forecast converts “we’ll be fine” into a testable claim with a named author. It is the single fastest way to make financial ownership unavoidable, because next week always arrives to grade the work.
Step 3 — Run monthly variance reviews on a three-question protocol. For every material variance: What happened? What part did we control? What changes so it doesn’t repeat? Notice what’s absent — there is no “whose fault externally” question. Variance analysis, run this way, stops being a reporting exercise and becomes the company’s accountability courtroom.
Step 4 — Publish the leadership scorecard. The six metrics above, visible to the whole leadership team, every month. Sunlight does most of the enforcement for you; leaders who see their Commitment Hit Rate ranked against their peers’ rarely need a second conversation.
Step 5 — Tie consequences to owned outcomes. Bonuses, recognition, and promotion criteria linked to scorecard results — and, symmetrically, real conversations when numbers are missed without ownership. Accountability without consequences is a suggestion.
90-Day Implementation Plan
| Phase | Days | Actions | Deliverable |
| Diagnose | 1–30 | Baseline the six scorecard metrics; calculate VOR and AGC; assign P&L line owners | Accountability baseline report |
| Install | 31–60 | Launch 13-week forecast; run first variance review on the 3-question protocol | Live forecast + first owned variance report |
| Enforce | 61–90 | Publish scorecard; tie Q-end reviews and comp criteria to owned outcomes | Operating accountability system |
Where a Fractional CFO Fits: Installing Accountability From Outside
Here is the uncomfortable structural truth: accountability systems are hardest to install from inside, because the people who would build the measurement are often the people being measured. A founder grading their own pipeline ownership, or a leadership team scoring its own variance discipline, faces an obvious conflict — which is precisely why 93% of workers in the Workplace Accountability Study couldn’t connect their work to results. Nobody inside the building was positioned to make the connection non-negotiable.
A strong CFO’s role in leadership accountability is not to police behavior. It is to make the link between leadership posture and financial outcomes impossible to ignore — and an external, fractional CFO does this with two advantages an internal hire can’t match: zero political debt, and no incentive to soften the numbers.
For most companies in the $2M–$50M range, the economics settle the question:
| Cost element | Full-time CFO | Fractional CFO |
| Base compensation | $250,000–$400,000/year | — |
| First-year all-in (benefits, payroll taxes, recruiting, equity) | $300,000–$600,000 | — |
| Monthly retainer | — | $3,000–$12,000 |
| Annualized cost | $300,000–$600,000 | $36,000–$144,000 |
| Typical savings | — | 60–80% |
| Time to start | 4–6 month search | 1–2 weeks |
Set that against the worked example above: a $233,000 annual accountability gap at a $10M company versus a fractional engagement that typically runs $60,000–$100,000 a year and exists specifically to close that gap. The [LINK: fractional CFO services → /cfo-services/] engagement pays for itself if it recovers even half of the gap — and installing forecasting discipline, variance ownership, and the leadership scorecard is exactly the work. For companies that also need the monthly close tightened first, a [LINK: fractional controller → /fractional-controller-services/] often precedes or pairs with the CFO engagement. You can see how this plays out in real companies in our [LINK: case studies → /case-studies/].
FAQs About Leadership Accountability
What is leadership accountability?
Leadership accountability is a leader’s obligation to answer for business outcomes — not just tasks or effort. An accountable leader owns the results of their decisions, their delays, and their unplanned risks, regardless of who executed the work. Unlike responsibility, accountability cannot be delegated: one name attaches to each outcome.
What is the difference between accountability and responsibility in leadership?
Responsibility is about doing the work and can be assigned to many people. Accountability is about answering for the result and belongs to exactly one person. A leader can delegate the forecasting task (responsibility) but still answers for the cash position the forecast was supposed to protect (accountability).
Why is leadership accountability important for business performance?
Because it is financially predictive. Gallup’s 2026 research found accountability is the weakest of seven core leadership competencies, and its global workplace study ties disengagement — driven primarily by leader behavior — to more than $10 trillion in lost productivity a year. At company level, weak accountability shows up as cash strain, revenue volatility, margin leakage, and eroded enterprise value.
How do you measure leadership accountability?
Use financial metrics rather than surveys: Variance Ownership Rate (owned variances ÷ total material variances), forecast accuracy within ±5–10%, days to close the books, corrective-action completion above 85%, repeat-variance rate below 15%, and commitment hit rate above 90%. Two quarters of monthly tracking reveals exactly where ownership breaks down.
What causes a lack of accountability in leadership?
The main drivers are unclear ownership (no single name per outcome), absent measurement (no forecast or scorecard to grade decisions against), feedback that only appears after failures — reported by 80% of employees — and leaders modeling deflection, which 84% of workers say is the biggest influence on their own accountability.
How does poor leadership accountability affect the balance sheet?
Each excuse has a financial address. Blaming the bank hides weak forecasting and lands as shrinking days cash on hand. Blaming the market hides a passive pipeline and lands as flat revenue. Deferred decisions land as margin leakage and churn. Skipped risk planning lands as contingent liabilities. A typical accountability gap can consume 15–20% of EBITDA.
Can a fractional CFO fix accountability problems?
Yes — it’s structurally what the role does best. An external CFO installs single-owner P&L lines, a rolling 13-week forecast, variance reviews with named owners, and a leadership scorecard, without the political debt an internal hire carries. At $3,000–$12,000 per month (60–80% below a full-time CFO’s all-in cost), the engagement typically pays for itself by recovering a fraction of the accountability gap.
What is an example of leadership accountability?
A CEO whose sales flatten in a slow market takes ownership of pipeline generation personally — committing to a weekly outreach cadence and a 3× pipeline coverage standard — instead of citing conditions. Companies that respond this way routinely grow in the same markets their competitors blame, because the controllable inputs were owned.
Excuses Find Their Way Into EBITDA
The final cost of weak leadership accountability is never a single bad decision or one missed quarter. It’s the cumulative degradation of every metric that matters: margins compressed by unowned inefficiency, revenue undermined by inconsistent execution, cash strained by planning nobody answered for, and enterprise value eroded by a leadership team the market learns it can’t trust to own outcomes.
Excuses do not stay in the room where they’re made. They find their way into the EBITDA line, the balance sheet, and the daily experience of every person in the company. Shensi Ding is right — in business as in life, ownership is non-negotiable. Leaders who stop blaming and start owning build companies that outlast volatility. Leaders who don’t create results that always, without exception, end up reflected in the numbers.
Seeing variance in your financials that no one seems to own? Book a free call. A fractional CFO brings the external perspective and financial discipline to identify where accountability gaps are costing your business — and what it takes to close them before they compound further. [Book Your Free CFO Strategy Call → /meet-with-stan/]