Learning how to read a balance sheet starts with three questions: What does the business own, what does it owe, and what is left for the owners? Then go further. Look at where cash is tied up, which obligations come due soon, how much debt supports the business, and how those numbers changed from the last reporting period.
A balance sheet isn’t just an accounting report.
Read correctly, it tells you how your business has financed itself and where much of the cash generated or raised by the company currently sits.
That is much more useful.
Key takeaways
- A balance sheet reports assets, liabilities, and equity at a specific point in time.
- The core equation is Assets = Liabilities + Equity.
- Don’t judge cash, receivables, inventory, debt, or equity in isolation. Compare them with related accounts and prior periods.
- Working capital and liquidity deserve attention because a profitable company can still have short-term cash pressure.
- The balance sheet becomes far more useful when you read it alongside the income statement and cash flow statement.
What does a balance sheet tell you?
A balance sheet tells you what a business owns, what it owes, and the owners’ financial interest in the company at a specific date. It helps you evaluate liquidity, working capital, leverage, asset investment, and financing structure, but it should be compared across periods and read alongside other financial statements for proper context.
The U.S. Securities and Exchange Commission describes a balance sheet as a statement showing a company’s assets, liabilities, and shareholders’ equity at a fixed point in time. Unlike an income statement, it doesn’t show activity over an entire month, quarter, or year. (SEC financial statement guide)
That’s the first distinction owners need to understand.
Your December 31 income statement may tell you that the company earned $700,000 during the year.
Your December 31 balance sheet answers a different question:
What financial position did all that activity leave you with on December 31?
Maybe cash increased.
Maybe accounts receivable absorbed most of the year’s growth.
Maybe the company bought equipment.
Maybe debt went up.
Maybe profits accumulated in retained earnings but aren’t sitting in the bank because the money has already been reinvested elsewhere.
The balance sheet helps you find out.
A balance sheet explained with a simple example
Before going through the five steps, start with a simplified statement.
Assume a growing service company reports this balance sheet:
| Balance sheet item | Current year | Prior year |
| Cash | $425,000 | $510,000 |
| Accounts receivable | $1,050,000 | $720,000 |
| Prepaid and other current assets | $125,000 | $110,000 |
| Total current assets | $1,600,000 | $1,340,000 |
| Property and equipment, net | $900,000 | $700,000 |
| Total assets | $2,500,000 | $2,040,000 |
| Accounts payable | $475,000 | $330,000 |
| Accrued expenses | $225,000 | $180,000 |
| Current portion of debt | $200,000 | $150,000 |
| Total current liabilities | $900,000 | $660,000 |
| Long-term debt | $650,000 | $500,000 |
| Total liabilities | $1,550,000 | $1,160,000 |
| Owner’s equity | $950,000 | $880,000 |
| Liabilities + equity | $2,500,000 | $2,040,000 |
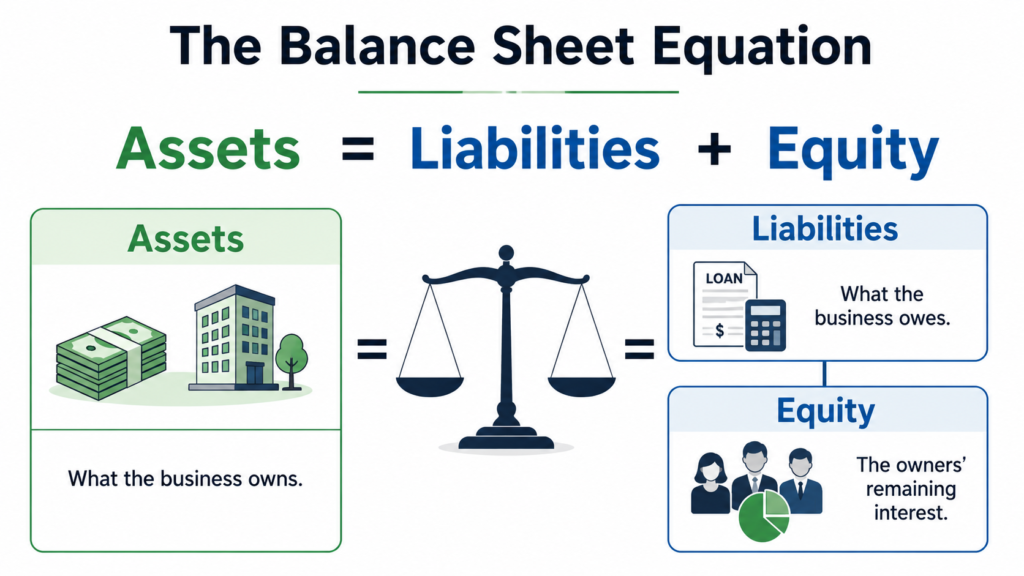
The basic accounting equation is:
Assets = Liabilities + Equity
The SEC and SBA both use this equation when explaining how the statement works.
In our example:
$2,500,000 = $1,550,000 + $950,000
It balances.
But “it balances” doesn’t mean “the company is healthy.”
That’s where analysis begins.
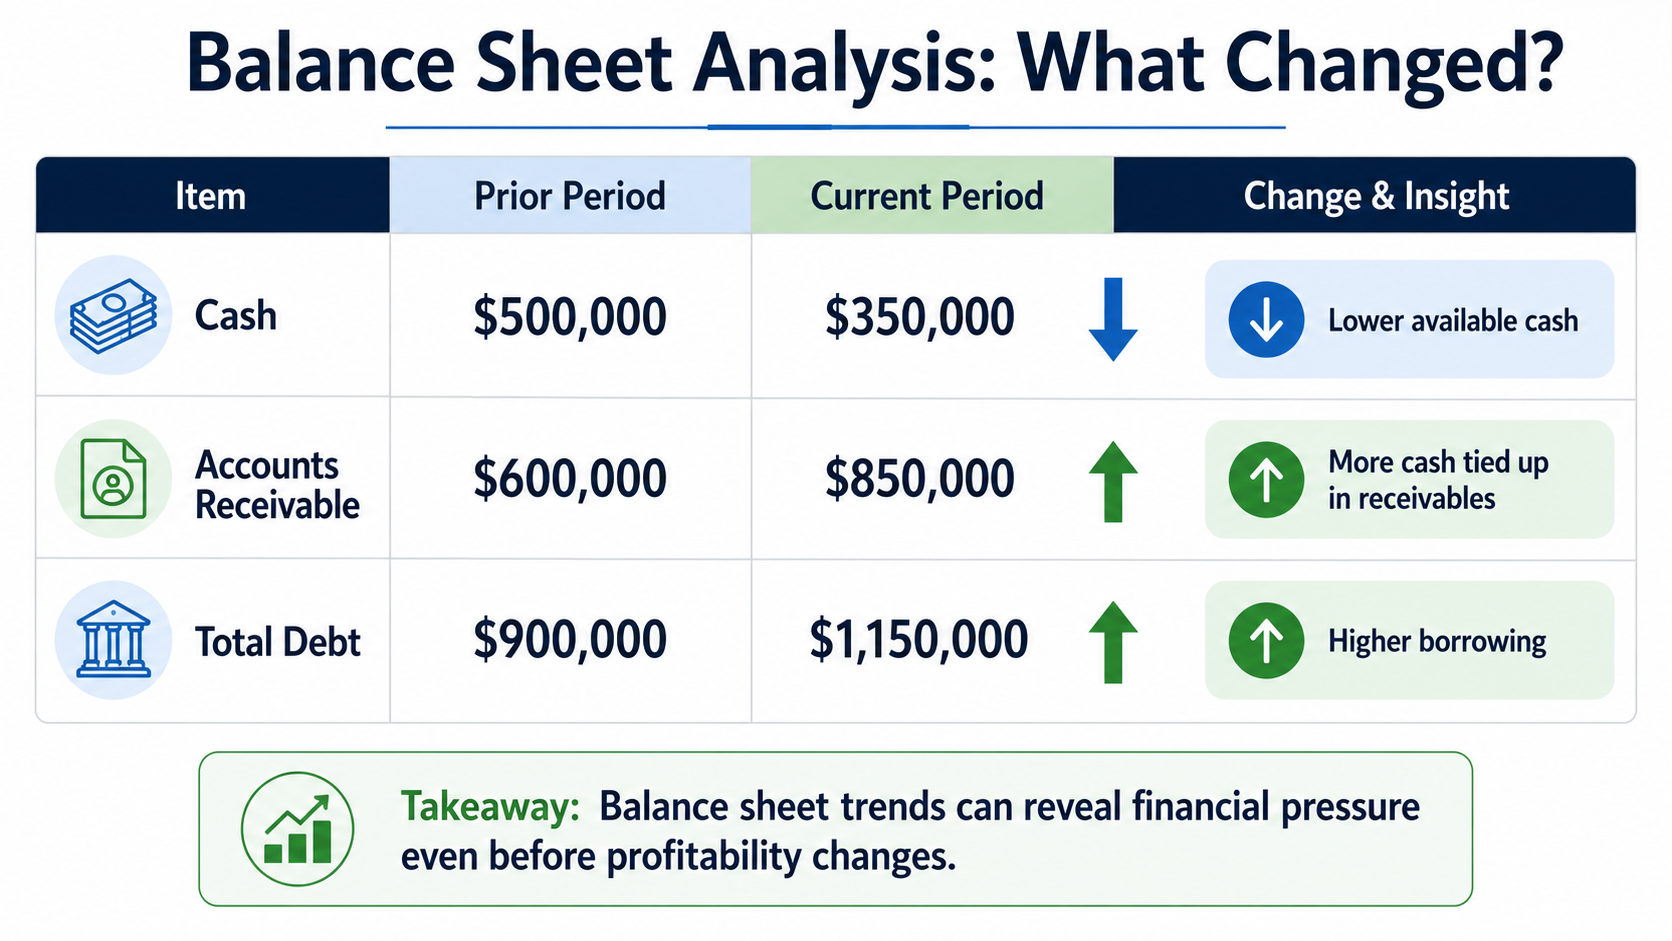
Cash fell $85,000.
Receivables increased by $330,000.
Current liabilities increased $240,000.
Long-term debt increased $150,000.
Equity rose only $70,000.
Those movements tell a much more interesting story than the $2.5 million total asset figure.
How to read a balance sheet in 5 steps
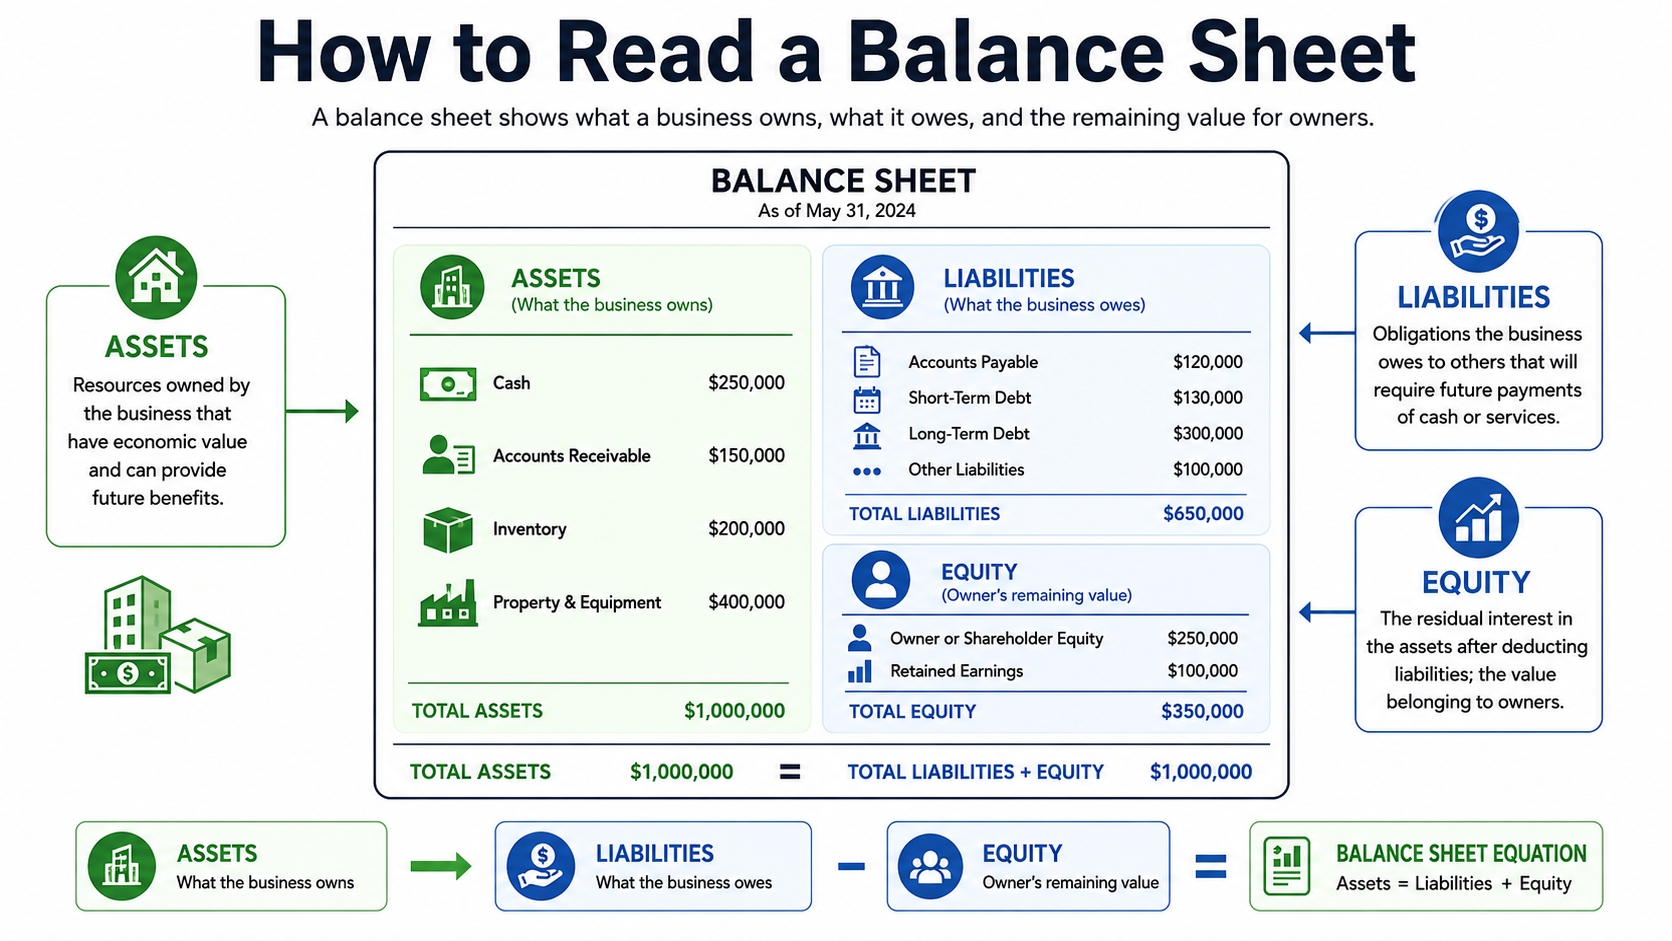
To read a balance sheet effectively, first confirm the reporting date and accounting equation, then review assets, liabilities, and equity before comparing the statement with prior periods. Finish by calculating a few decision-useful ratios. The goal is not to memorize account definitions. It is to understand liquidity, obligations, financing, and changes in financial position.
Step 1: Check the date and make sure the statement balances
Start at the top.
What date is the statement for?
A balance sheet might say:
As of December 31, 2026
That matters because the numbers describe that moment.
The SEC explicitly distinguishes balance sheets from income and cash flow statements on this point: a balance sheet is a point-in-time snapshot, while the other statements show activity over a period.
Next, confirm:
Assets = Liabilities + Equity
Your accounting system should produce a balanced statement automatically.
If it doesn’t, don’t analyze anything yet.
You have a bookkeeping or reporting problem.
Even when it balances mathematically, look for obvious accounting problems. Negative asset balances, old clearing accounts, loans sitting in accounts payable, large unexplained “other assets,” or accounts that haven’t changed in a year can make the statement technically balanced and economically useless.
This is one reason reliable accounting services come before advanced financial strategy. A CFO can’t make sound decisions from a balance sheet nobody trusts.
Step 2: Read assets for liquidity and cash tied up in the business
Assets are resources controlled by the company.
The SEC divides them broadly into current assets, which are expected to convert to cash or be used within roughly a year, and non-current assets, which have a longer life.
For an owner, don’t just ask:
How many assets do we have?
Ask:
What are those assets made of?
In our sample company, total current assets rose from $1.34 million to $1.60 million.
Looks positive.
But cash fell from $510,000 to $425,000 while accounts receivable jumped from $720,000 to $1.05 million.
That’s different.
The company has more current assets, but a larger share is sitting in customer invoices instead of the bank.
If sales grew rapidly, part of that increase may be normal.
If sales barely changed, I’d want to see the A/R aging immediately.
The same logic applies to inventory.
A manufacturer may report $2 million of inventory as an asset. That doesn’t mean management has $2 million available for payroll.
Some may be raw material.
Some may be work in progress.
Some may be finished goods.
Some may be slow-moving stock that is unlikely to convert to cash at its recorded value anytime soon.
Liquidity matters more than the headline asset total when the immediate question is whether the company can meet short-term obligations.
Then look at fixed assets.
Equipment increasing from $700,000 to $900,000 could mean the company invested for growth. Fine.
But what financed it?
Cash?
Debt?
A capital contribution?
That answer sits elsewhere on the balance sheet.
This is why you read across relationships instead of reading down account names.
Step 3: Read liabilities for timing, debt, and upcoming cash demands
Liabilities show the obligations the business owes to suppliers, employees, lenders, tax authorities, customers, and other parties. Current liabilities generally come due within one year, while long-term liabilities are due later. The key management question is not only how much the company owes, but when the cash has to leave.
The SEC uses the same current-versus-long-term distinction when describing balance-sheet liabilities.
Start with accounts payable.
In the example, A/P increased from $330,000 to $475,000.
That could be perfectly normal if purchases increased with growth.
Or it could mean the business is stretching vendors because cash is tight.
Same number. Two very different explanations.
Look at accrued expenses next.
Accrued payroll, bonuses, taxes, interest, and other costs may already have hit the income statement without having been paid yet.
That means profit has recognized the expense, but cash still has to leave.
Then examine debt.
Don’t look only at the long-term loan balance.
The current portion of long-term debt matters because that principal must be paid sooner.
Our hypothetical company has:
- $200,000 of current debt obligations
- $650,000 of longer-term debt
That means $850,000 of debt is on the balance sheet, but the timing is different.
A company can carry a manageable total debt balance and still run into cash pressure if too much comes due in the next 12 months.
The opposite is also true. A larger loan with a sensible repayment structure may place less immediate strain on working capital than a smaller obligation due quickly.
This is where fractional CFO services go beyond reporting the liability balance. The management issue is what those obligations do to future cash requirements, borrowing capacity, and decision-making.
Step 4: Read equity and understand how the business has been funded
Equity represents the owners’ financial interest after liabilities are deducted from assets. It may include contributed capital, retained earnings, and other equity accounts depending on the legal structure. Equity is an accounting measure of ownership interest, not a direct statement of what the business would sell for today.
The SEC describes shareholders’ equity as what would remain after assets were used to satisfy liabilities, while the SBA describes owner’s equity in broadly similar terms.
Here’s where owners often get tripped up.
Suppose your balance sheet shows $950,000 of equity.
That does not mean you have $950,000 in cash.
And it does not automatically mean a buyer would pay $950,000 for the company.
Equity is the residual accounting interest:
Equity = Assets − Liabilities
In our example:
$2,500,000 − $1,550,000 = $950,000
Where is that equity?
It’s embedded across the entire balance sheet.
Some is represented by cash.
Some is sitting in receivables.
Some is tied up in equipment.
That’s why an owner can say, “We’ve made money for years. Where did it go?”
Often, part of the answer is sitting right here.
The business funded receivables.
It bought equipment.
It paid down debt.
It built inventory.
It distributed cash.
The balance sheet preserves the cumulative effect of many of those decisions.
Equity should also be compared across periods.
If the business has produced profit but equity barely grows, check distributions, losses, prior-period adjustments, and capital movements.
If business value itself is the question, that requires a different analysis. Business valuation services examine economic value rather than simply treating book equity as a sale price.
Step 5: Compare periods and calculate the ratios that matter
The most useful balance sheet analysis compares the current statement with prior periods and then calculates a small set of ratios tied to management questions. Trend analysis shows where cash, receivables, inventory, payables, debt, and equity are moving, while ratios help put those balances into relationships that raw dollar amounts cannot show alone.
Never ask only:
“What’s our accounts receivable?”
Ask:
“What was A/R three months ago, and how fast has it grown relative to sales?”
Never ask only:
“How much debt do we have?”
Ask:
“Did debt rise faster than equity or operating capacity?”
In our example:
| Account | Prior year | Current year | Change |
| Cash | $510,000 | $425,000 | −$85,000 |
| Accounts receivable | $720,000 | $1,050,000 | +$330,000 |
| Current liabilities | $660,000 | $900,000 | +$240,000 |
| Long-term debt | $500,000 | $650,000 | +$150,000 |
| Equity | $880,000 | $950,000 | +$70,000 |
Total assets grew 22.5%.
That’s not enough information to call the year strong.
The company financed part of that growth through higher current liabilities and more long-term debt, while cash declined.
Maybe that’s a smart investment phase.
Maybe collections weakened.
Maybe the company bought equipment to support a larger operation.
We need the income statement and cash flow statement to know.
That’s the point.
Balance sheet growth is not automatically financial improvement. You have to understand what grew and how it was funded.
Which balance sheet ratios should a business owner watch?
The most useful balance-sheet ratios for many business owners are working capital, the current ratio, and a leverage measure such as debt-to-equity. These metrics help answer whether short-term assets cover near-term obligations and how heavily the business relies on liabilities relative to owner capital, but the right targets vary by industry and business model.
The SEC notes that financial ratios need context and that desirable ratios vary by industry. It specifically discusses working capital and debt-to-equity analysis.
Here are three useful starting points.
| Metric | Formula | Management question |
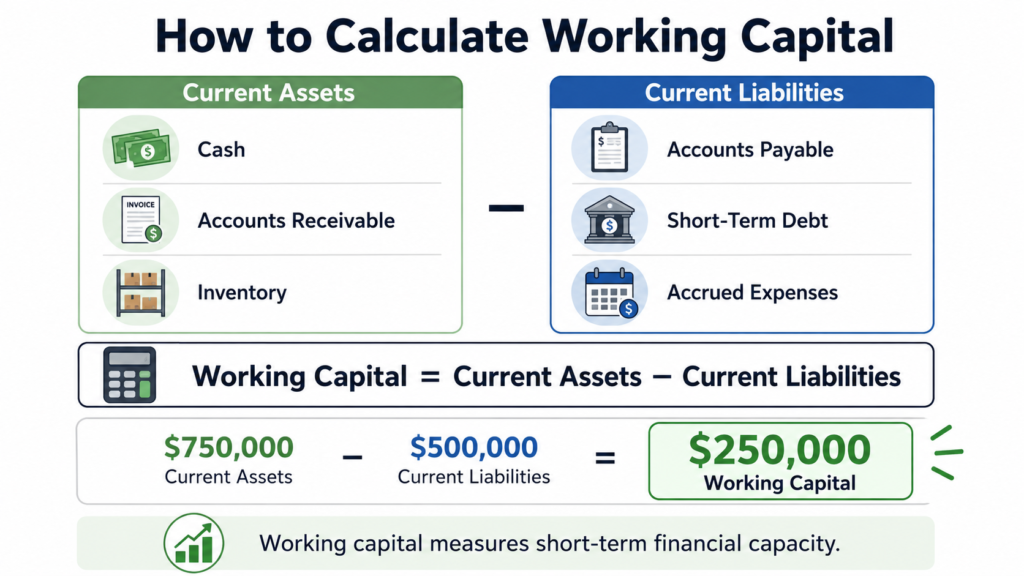
| Working capital | Current assets − Current liabilities | How much short-term financial cushion exists? |
| Current ratio | Current assets ÷ Current liabilities | How many dollars of current assets support each dollar of current liabilities? |
| Debt-to-equity | Debt or liabilities ÷ Equity, depending on definition used | How heavily is the company financed through obligations versus owner capital? |
Using our hypothetical balance sheet:
Working capital
$1,600,000 − $900,000 = $700,000
Prior year:
$1,340,000 − $660,000 = $680,000
Working capital increased by only $20,000 even though total current assets rose $260,000.
Why?
Current liabilities rose almost as fast.
That is a much more useful observation than saying, “Current assets increased.”
Current ratio
$1,600,000 ÷ $900,000 = 1.78
The company has about $1.78 of current assets for every $1 of current liabilities.
But again, quality matters.
If much of the current asset balance is old receivables or slow-moving inventory, the ratio can look stronger than the actual cash position.
Debt-to-equity
Use a consistent definition.
Some analysts use interest-bearing debt divided by equity. Others use total liabilities divided by equity. State which one your dashboard uses and don’t quietly change the formula month to month.
The ratio itself isn’t the decision.
The trend is.
If leverage rises while cash falls and receivables stretch, pay attention.
What are the biggest balance sheet red flags?
Balance sheet red flags include shrinking cash, receivables growing faster than sales, old inventory, rising accounts payable without matching growth, growing short-term debt, unexplained balances, negative equity, and large movements that management cannot reconcile. No single item proves the business is unhealthy, but unexplained trends deserve investigation.
Here’s the practical CFO view:
| Red flag | What it may mean |
| Cash declining while profit rises | Profit is being absorbed somewhere else |
| A/R growing faster than revenue | Collections may be weakening |
| Inventory rising without matching sales | Cash may be trapped in stock |
| A/P increasing sharply | Purchasing grew or vendor payments slowed |
| Short-term debt rising | Operations may be relying on borrowing for liquidity |
| Large “other asset” balances | Accounting detail may be hiding an issue |
| Equity declining | Losses, distributions, or adjustments may be eroding net worth |
| Balance doesn’t reconcile to supporting schedules | Reporting quality needs attention |
Do not turn these into automatic verdicts.
A/R should increase when a healthy business grows on credit.
Debt may rise because the company financed a productive asset.
Cash might fall because management deliberately made a large capital investment.
That’s why the word unexplained matters.
In 30+ years of financial leadership work, the recurring pattern Stan Alhadeff has seen is that the balance-sheet total is rarely the real issue. The management value comes from explaining the movement underneath it.
Business CFO for Hire has worked with clients where financial analysis identified 20%+ in savings within the first year, and one engagement secured $1.5 million in alternative funding. Those outcomes are examples of what happens when financial statements become inputs to operating and financing decisions rather than reports that simply get filed away.
If your balance sheet contains numbers you can’t confidently explain, every Business CFO for Hire engagement begins with a free discovery and GAP Analysis. A free CFO strategy call can help identify whether the real issue sits in accounting accuracy, working capital, debt, forecasting, or financial management.
What can’t a balance sheet tell you?
A balance sheet cannot tell you everything about business performance because it shows financial position at one point in time rather than revenue, expenses, profit, or cash movement across a period. It also records assets and liabilities under accounting rules, so book values should not automatically be treated as current market or business values.
This limitation is easy to forget.
Take two companies with identical December 31 balance sheets.
One generated $10 million of revenue during the year.
The other generated $20 million.
One produced strong operating cash flow.
The other borrowed heavily just before year-end.
The single-day balance sheet won’t explain all of that.
The SEC explicitly states that the balance sheet does not show flows into and out of accounts during the reporting period and explains that the financial statements are related to one another.
A balance sheet also won’t tell you everything that makes a company valuable.
It doesn’t directly tell you the quality of your management team.
It doesn’t show customer concentration clearly.
It doesn’t automatically reveal whether your pipeline is collapsing.
It doesn’t tell you if a competitor just took your largest account.
And book equity isn’t a valuation.
Those limits don’t weaken the statement.
They tell you how to use it correctly.
How should you use the balance sheet with the income statement and cash flow statement?
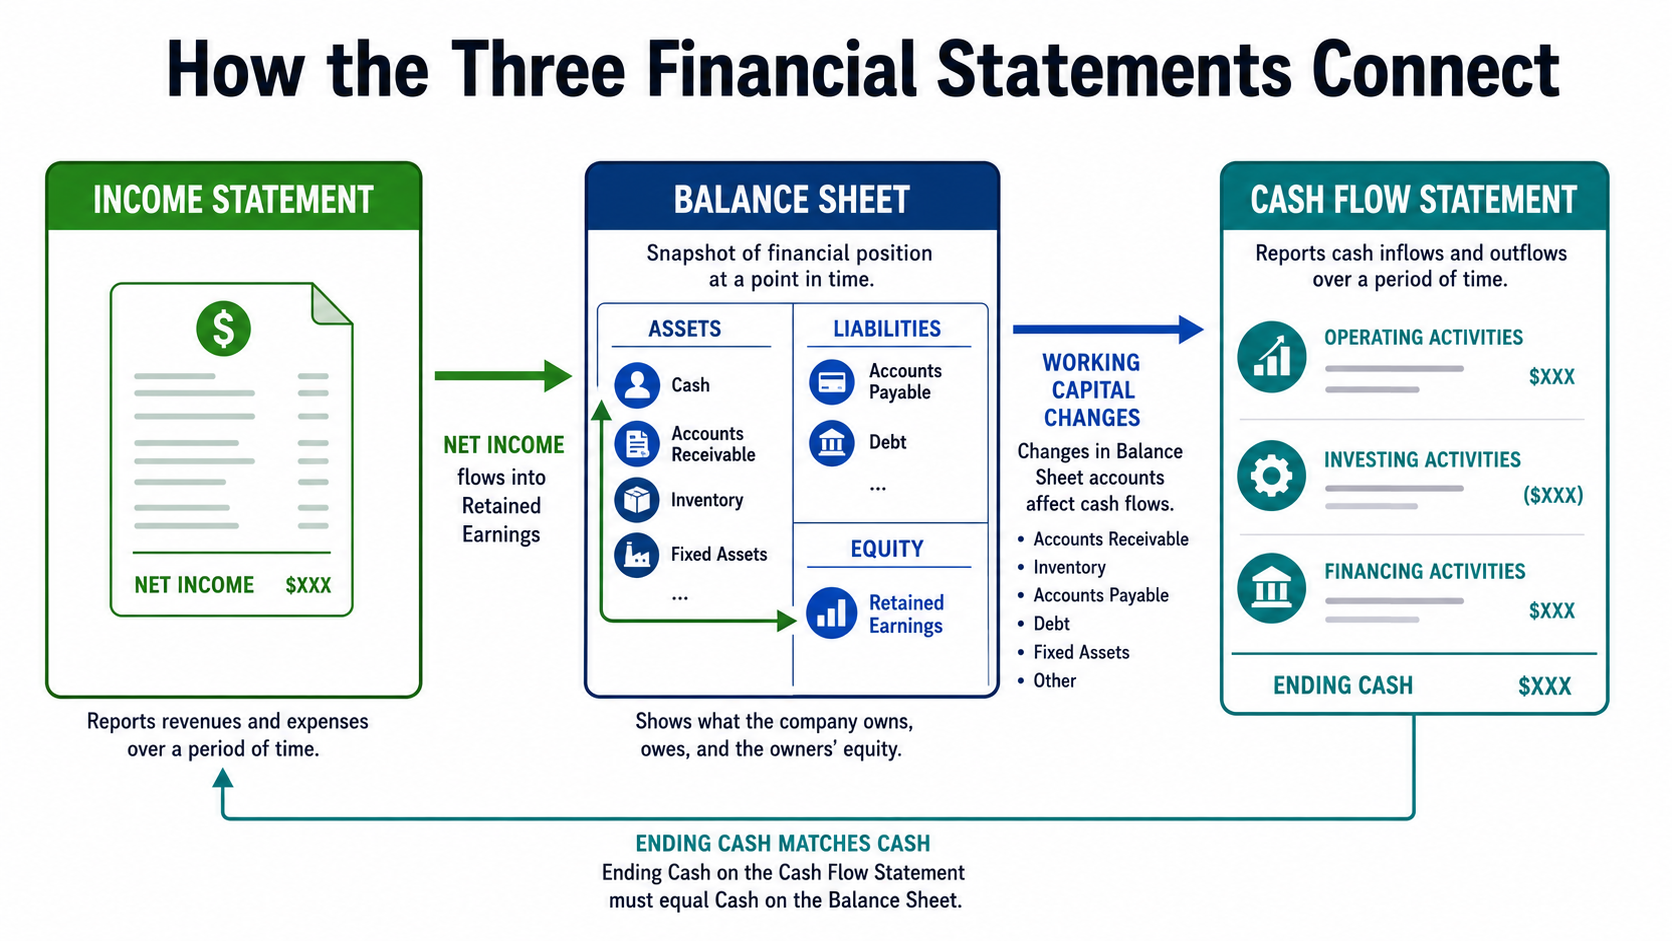
Use the balance sheet to understand financial position, the income statement to understand profitability over a period, and the cash flow statement to understand how cash moved. Reading the three together helps explain where profits went, how growth was financed, and why a company’s bank balance may move differently from reported earnings.
The SEC describes these statements in the same way: balance sheets report position at a fixed point, income statements report earnings and expenses across a period, and cash flow statements report cash inflows and outflows.
Suppose your income statement shows:
Net income: $600,000
Good.
Now your balance sheet shows:
Accounts receivable increased $350,000.
Your cash flow analysis may show that part of the profit hasn’t been collected yet.
Maybe equipment also increased $200,000.
Now we know another place cash went.
Then debt increased $150,000.
Now we see how part of that equipment or working-capital requirement was financed.
One report gives you a piece.
Together they tell the story.
This is where a good fractional controller and CFO serve different but connected roles. The financial statements first need to be accurate, timely, and reconciled. Then management can use those numbers for forecasting, capital planning, and decisions.
Turn balance sheet analysis into a monthly management habit
Learning how to read a balance sheet doesn’t require memorizing every account.
Start with the same questions each month.
Where did cash move?
What happened to receivables and inventory?
What bills and debt come due soon?
How did working capital change?
Did growth increase debt faster than equity?
Which balance changed enough that someone should explain it?
That routine turns the balance sheet from an accounting document into a management tool.
Stan Alhadeff brings more than 30 years of financial leadership experience to Business CFO for Hire and has managed companies ranging from startups to businesses exceeding $1 billion in revenue. One long-term client, Amerigo Metal Recycling, grew from $8 million to nearly $50 million in sales over more than a decade.
At that level of growth, the job isn’t just producing statements.
It’s understanding what the statements are telling you before a working-capital problem, debt constraint, or reporting weakness becomes expensive.
You can find more practical financial-management resources in the Business CFO for Hire Knowledge Center and review examples of prior work through the firm’s case studies.
If you can read your P&L but still aren’t sure what your balance sheet is telling you about cash, debt, and working capital, book a free CFO strategy call. The useful next step is not another report. It’s knowing which balance-sheet movement deserves a decision.
FAQ
What are the three main parts of a balance sheet?
The three main parts of a balance sheet are assets, liabilities, and equity. Assets represent resources owned or controlled by the business, liabilities represent obligations owed to others, and equity represents the owners’ residual financial interest after liabilities are deducted from assets. Together they follow the equation Assets = Liabilities + Equity.
What should you look at first on a balance sheet?
Start by checking the statement date, total cash, current assets, current liabilities, and whether assets equal liabilities plus equity. Then compare those balances with the previous period. The first goal isn’t to judge whether individual numbers look large or small. It’s to identify material changes that need an explanation.
How do you know if a balance sheet is healthy?
A healthy balance sheet generally has enough liquidity to meet near-term obligations, manageable leverage, reliable asset balances, and equity that supports the company’s financial needs. There is no single ratio that proves financial health. Compare trends, industry economics, debt obligations, asset quality, and cash requirements before concluding.
What is the balance sheet equation?
The balance sheet equation is Assets = Liabilities + Equity. Every asset on the statement must ultimately be financed either through an obligation or through owners’ equity. The equation always balances in properly maintained financial statements, although mathematical balance alone does not prove that every underlying account is accurate.
What is working capital on a balance sheet?
Working capital is current assets minus current liabilities. It provides a simple view of the short-term financial resources remaining after current obligations are deducted from current assets. A positive number can be useful, but owners should also examine the quality of receivables and inventory because not every current asset converts to cash equally quickly.
What is the difference between current and non-current assets?
Current assets are generally expected to convert to cash or be used within about one year, while non-current assets remain in the business longer. Cash, accounts receivable, and inventory commonly appear as current assets. Property, equipment, and many intangible assets generally appear in the non-current section.
Is owner’s equity the same as the value of a business?
No, owner’s equity on a balance sheet is not automatically the market value of the business. Book equity is calculated from accounting asset and liability balances. A business valuation may consider earnings, cash flow, risk, market conditions, intangible value, and other factors that aren’t captured by simply subtracting recorded liabilities from recorded assets.
Why should you compare balance sheets from different periods?
Comparing balance sheets across periods reveals trends that a single statement can hide. You can see whether cash is falling, receivables are building, debt is increasing, inventory is accumulating, or equity is changing. Those movements often provide more useful management information than any one ending balance viewed by itself.