
A profit and loss statement, or P&L, shows how much money your business made and spent over a specific period, ending in a single bottom-line number: net profit or net loss. Reading one means working through it top to bottom — revenue, costs, expenses — and understanding what each step is telling you, not just checking whether the final number is positive.
That last part is where most explanations stop short. This guide walks through a complete, annotated example so you can see exactly what to look for at each line, not just what the labels mean.
Key takeaways
- A P&L statement, also called an income statement, reports revenue, costs, and expenses over a period of time, ending in net profit or loss.
- Reading a P&L well means comparing relationships between the numbers — gross margin, operating margin, and how each line moves against last month or last year — not just checking the bottom line.
- The structure runs top to bottom: revenue, minus cost of goods sold equals gross profit, minus operating expenses equals operating profit, minus interest and taxes equals net profit.
- A healthy gross margin can still hide a weak operating margin. The gap between the two tells you exactly where to look for the problem.
- Reviewing your P&L monthly, not just at tax time, is what turns it from a compliance document into a decision-making tool.
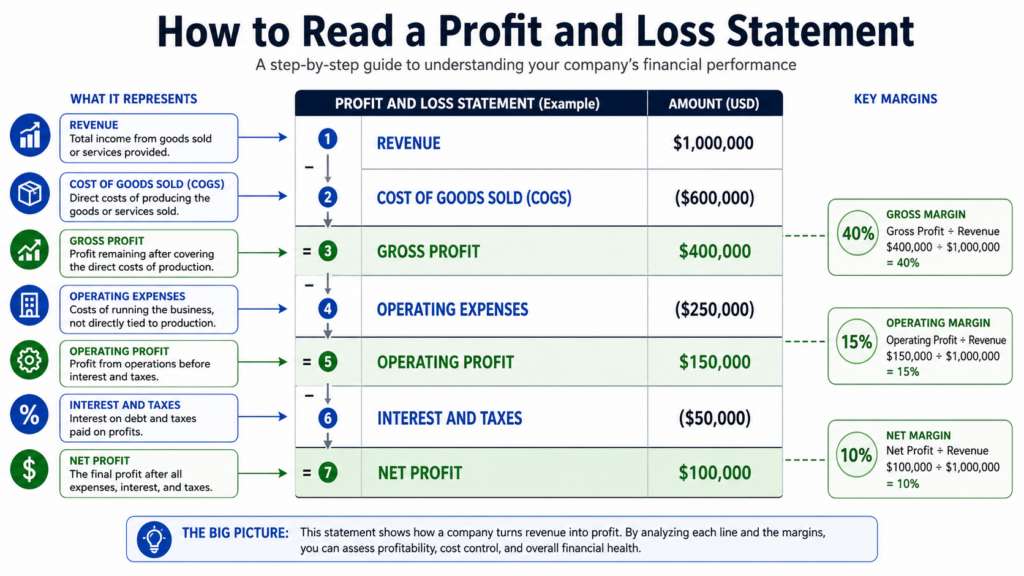
What is a profit and loss statement (P&L)?
A profit and loss statement is a financial report that shows a business’s revenue, costs, and expenses over a specific period, ending in net profit or net loss — the bottom line. It’s one of the three core financial statements, alongside the balance sheet and cash flow statement, and it’s the one most owners check first because profitability is usually the most immediate question on their mind.
“P&L” and “income statement” refer to the same document — different names for the same report, used somewhat interchangeably depending on the industry and who’s talking. Whichever term your accountant uses, the structure and the numbers underneath it are identical.
The structure of a P&L, top to bottom
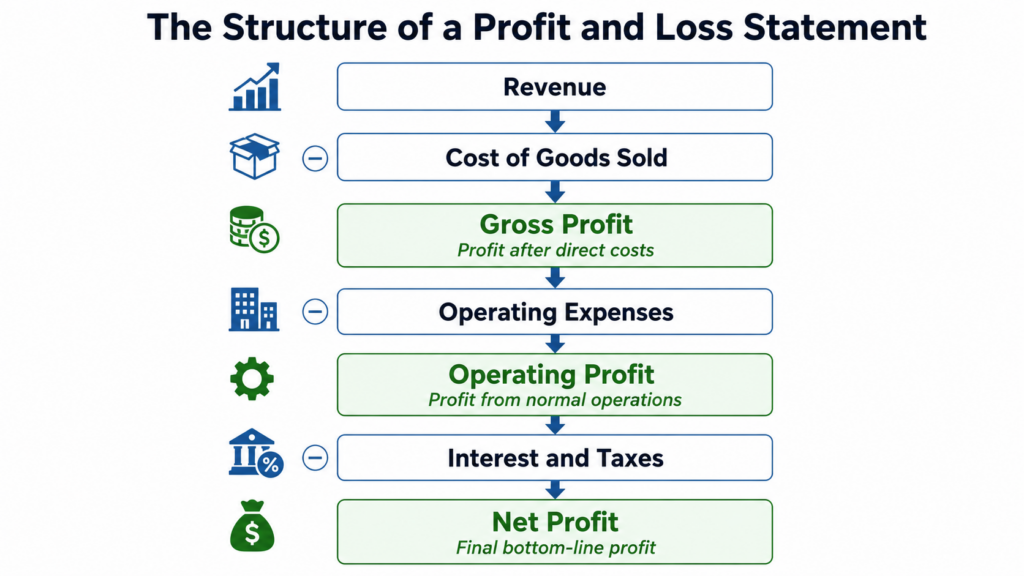
Every P&L follows the same basic order: revenue at the top, then costs and expenses subtracted in stages, ending in net profit at the bottom. Revenue minus cost of goods sold equals gross profit. Gross profit minus operating expenses equals operating profit. Operating profit minus interest and taxes equals net profit — the final number.
Each of those three profit tiers — gross, operating, net — measures something different, and the differences between them matter more than any one number alone. For a deeper breakdown of exactly what each tier measures and how to use the gaps between them diagnostically, gross profit vs. operating profit vs. net profit covers that in full. The rest of this guide focuses on reading a complete, real P&L line by line.
A fully annotated P&L example
Numbers make this concrete. Here’s a full P&L for a hypothetical $3.5 million specialty retail business with three store locations, with commentary on what each line is actually telling you.
| Line item | Amount | What it tells you |
| Revenue | $3,500,000 | Total sales across all three locations for the year |
| Cost of goods sold | ($1,540,000) | What it cost to acquire and stock the merchandise sold |
| Gross profit | $1,960,000 | 56% gross margin — a genuinely strong number for specialty retail |
| Payroll (store staff + management) | ($980,000) | The largest single expense line, typical for a people-heavy retail model |
| Rent (three locations) | ($420,000) | Fixed cost regardless of sales volume — the second-biggest structural expense |
| Marketing | ($175,000) | 5% of revenue, a reasonable spend for driving foot traffic |
| Other G&A (insurance, software, admin) | ($210,000) | The catch-all overhead category — worth reviewing line by line if it grows faster than revenue |
| Operating profit | $175,000 | Just 5.0% operating margin — most of that strong gross profit got absorbed by overhead |
| Interest expense | ($28,000) | Cost of carrying debt, likely inventory financing or a location buildout loan |
| Taxes | ($37,000) | Based on taxable income after all other deductions |
| Net profit | $110,000 | 3.1% net margin — thin, and worth understanding why given how strong the gross margin looked |
Read top to bottom, the real story doesn’t show up until partway down the page. This business prices and buys well — a 56% gross margin is genuinely healthy. But by the time payroll, rent, and overhead are factored in, operating margin drops to 5%, and net margin lands at just 3.1%. Someone who only checked the gross margin would think the business was thriving. Someone who only checked net profit would see a modest but real number and move on. Reading every line is what reveals the actual issue: this is an overhead problem, not a pricing or buying problem.
What to look for beyond the bottom line
The single most useful habit is checking the gap between each profit tier, not just whether net profit is positive, because the size of each gap tells you where to focus. A big drop between gross profit and operating profit — like the retail example above — points to overhead: payroll, rent, or administrative costs consuming more of each sales dollar than they should.
A big drop between operating profit and net profit points somewhere else entirely: debt load, interest rates, or tax structure. In 30-plus years of CFO work, the pattern Stan Alhadeff sees most often is an owner who reads the bottom line every month, watches it hold roughly steady, and never notices that the composition underneath it has shifted — gross margin quietly eroding while overhead grew to offset it, or vice versa. Two months can show the identical net profit number for completely different reasons, and only reading every line catches the difference.
Trend matters as much as any single month. A P&L compared against the prior month, the same month last year, and your budget tells you far more than one snapshot in isolation ever will.
How often should you review your P&L?
Review your P&L monthly, as part of your regular close process, not just at tax time or when a lender asks for it. Monthly review catches a margin shift or an overhead creep while it’s still a small, fixable problem instead of a full year’s worth of drift discovered all at once.
According to the Oregon Small Business Development Center Network, part of the SBA’s nationwide network of small business resource partners, reading your P&L is best approached as a repeatable habit — a series of simple calculations reviewed regularly — rather than a document revisited only when something feels wrong. That habit is the difference between a P&L that’s a compliance artifact and one that’s an actual management tool.
Common mistakes when reading a P&L
The most common mistake is stopping at the bottom line and treating it as the whole story, when the real information usually sits in the relationships between the lines above it. A second common mistake is comparing your P&L to a different type of business — a services company and a retailer will show structurally different gross margins even when both are run well, so the comparison that actually matters is your own business over time.
A third mistake is reviewing the P&L in isolation from the rest of your financials. A strong P&L and a weak cash position can coexist, especially if receivables are slow or inventory is tying up cash — profit on paper and cash in the bank are related but different questions. If you want a clear read on what your own P&L is actually telling you, our free discovery call includes a GAP Analysis that walks through it with you directly.
Turning the P&L into a decision-making tool
A P&L you can read but don’t act on is just an interesting document. The value shows up when a widening gap between gross and operating margin prompts a real look at overhead, or when a trend across several months changes a pricing or staffing decision before it becomes urgent.
None of that works if the underlying numbers aren’t trustworthy in the first place — a P&L is only as good as the bookkeeping and accounting services behind it. If you’re not confident your monthly P&L is accurate, timely, and built on a clean chart of accounts, that’s the place to start before anything else. Book a free strategy call with Stan — it starts with a straight look at what your own numbers are actually showing.
FAQ
What is a profit and loss statement? A profit and loss statement, or P&L, is a financial report showing a business’s revenue, costs, and expenses over a specific period, ending in net profit or net loss. It’s also called an income statement, and the two terms refer to the same document.
How do you read a P&L statement? Read a P&L from top to bottom: start with revenue, subtract cost of goods sold to get gross profit, subtract operating expenses to get operating profit, then subtract interest and taxes to get net profit. The real insight comes from comparing the gaps between each of those tiers, not just checking the final number.
What is the difference between a P&L statement and an income statement? There is no difference — P&L statement and income statement are two names for the same financial report. Different industries and accountants use the terms somewhat interchangeably, but the structure and the numbers are identical either way.
What should you look for on a P&L statement? Look for the size of the gap between gross profit, operating profit, and net profit, since each gap points to a different issue — overhead, debt, or taxes. Also compare the current period against last month, the same month last year, and your budget, since a single month in isolation can be misleading.
How often should a business review its P&L? A business should review its P&L monthly as part of the regular financial close, not only at tax time or when a lender requests it. Monthly review catches a margin or expense shift while it’s still small enough to fix easily.

Stan Alhadeff
Founder & Fractional CFO